MANHATTAN RENTAL MARKET REPORT

MANHATTAN RENTAL MARKET REPORT ARCHIVE
sign up for rental Market reports to be sent to your email
TABLE OF CONTENTS
JUMP TO A PARTICULAR SECTION
introduction
THE AVERAGE RENT IN MANHATTAN HAS INCREASED THIS MONTH.
-
CHANGE
-
$4,928JANUARY 2026
-
$5,057FEBRUARY 2026
A QUICK LOOK

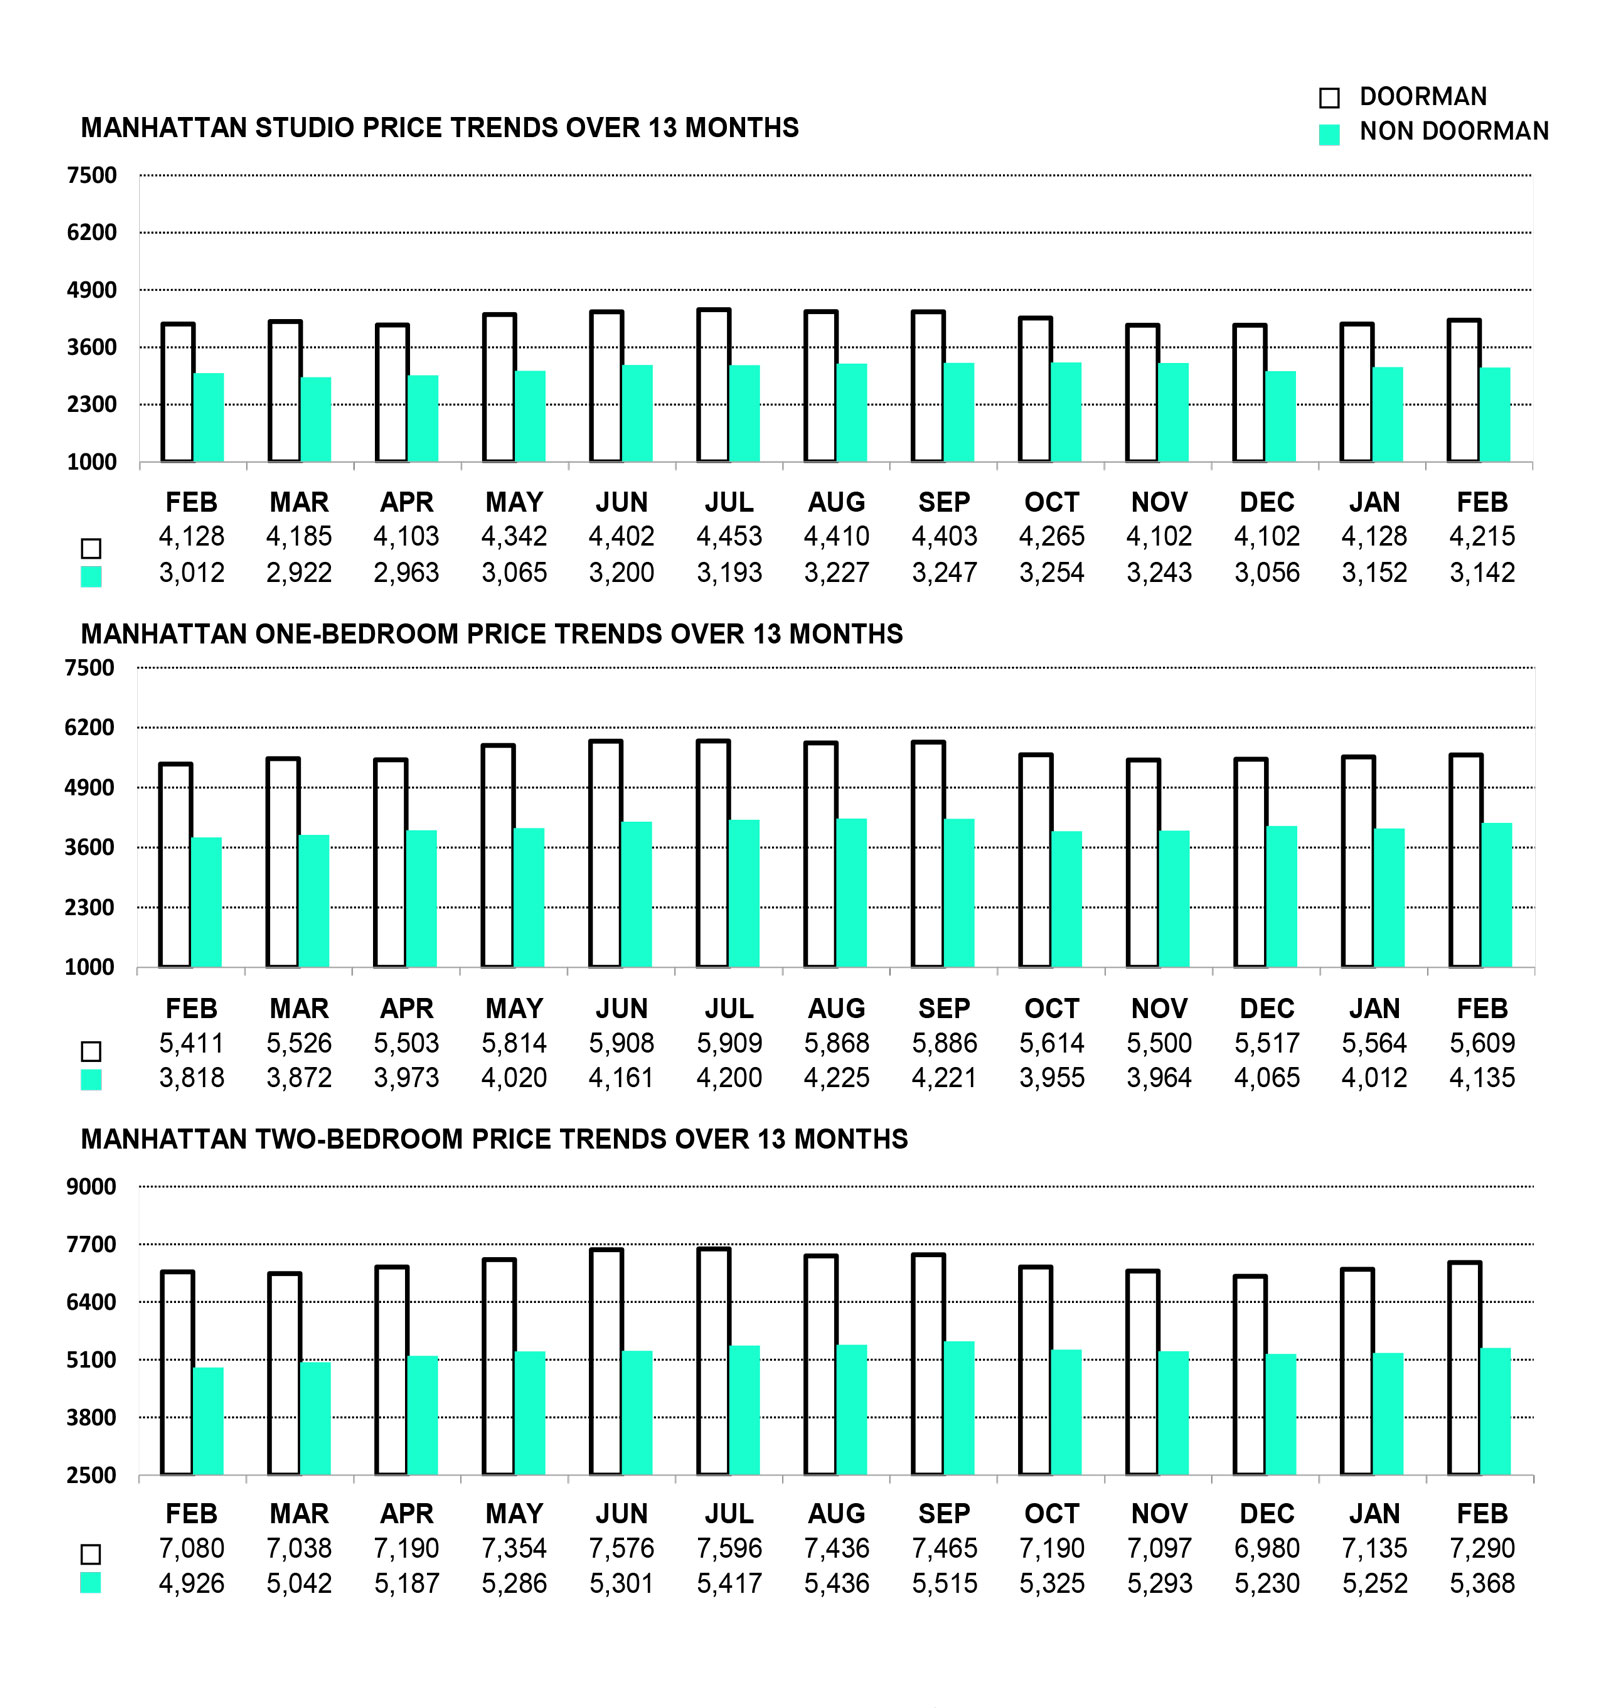
Over the last month, the average rental price in Manhattan increased by 2.63%, from $4,928 to $5,057. The average rental price for a non-doorman studio unit decreased by 0.32%, from $3,152 to $3,142. The average rental price for a non-doorman one-bedroom unit increased by 3.07%, from $4,012 to $4,135. The average rental price for a non-doorman two-bedroom unit increased by 2.21%, from $5,252 to $5,368. The average rental price for a doorman studio unit increased by 2.10%, from $4,128 to $4,215. The average rental price for a one-bedroom doorman unit increased by 0.81%, from $5,564 to $5,609. The average rental price for a doorman two-bedroom unit increased by 2.18%, from $7,135 to $7,290.
Year-over-year, the average rental price for a non-doorman studio increased by 4.31%, and the average rental price for a doorman studio increased by 2.10%. The average rental price for a non-doorman one-bedroom unit increased by 8.31%, and doorman one-bedroom units saw their average rental price increase by 3.66%. The average rental price for a non-doorman two-bedroom unit increased by 8.97%, while the average rental price for doorman two-bed room units increased by 2.97%. Overall, the average rental price in Manhattan increased by 5.41% from this time last year.
NOTABLE TRENDS
| TYPE | MOST EXPENSIVE | LEAST EXPENSIVE |
|---|---|---|
| Non-doorman studios | Gramercy $3,961 | Harlem $2,305 |
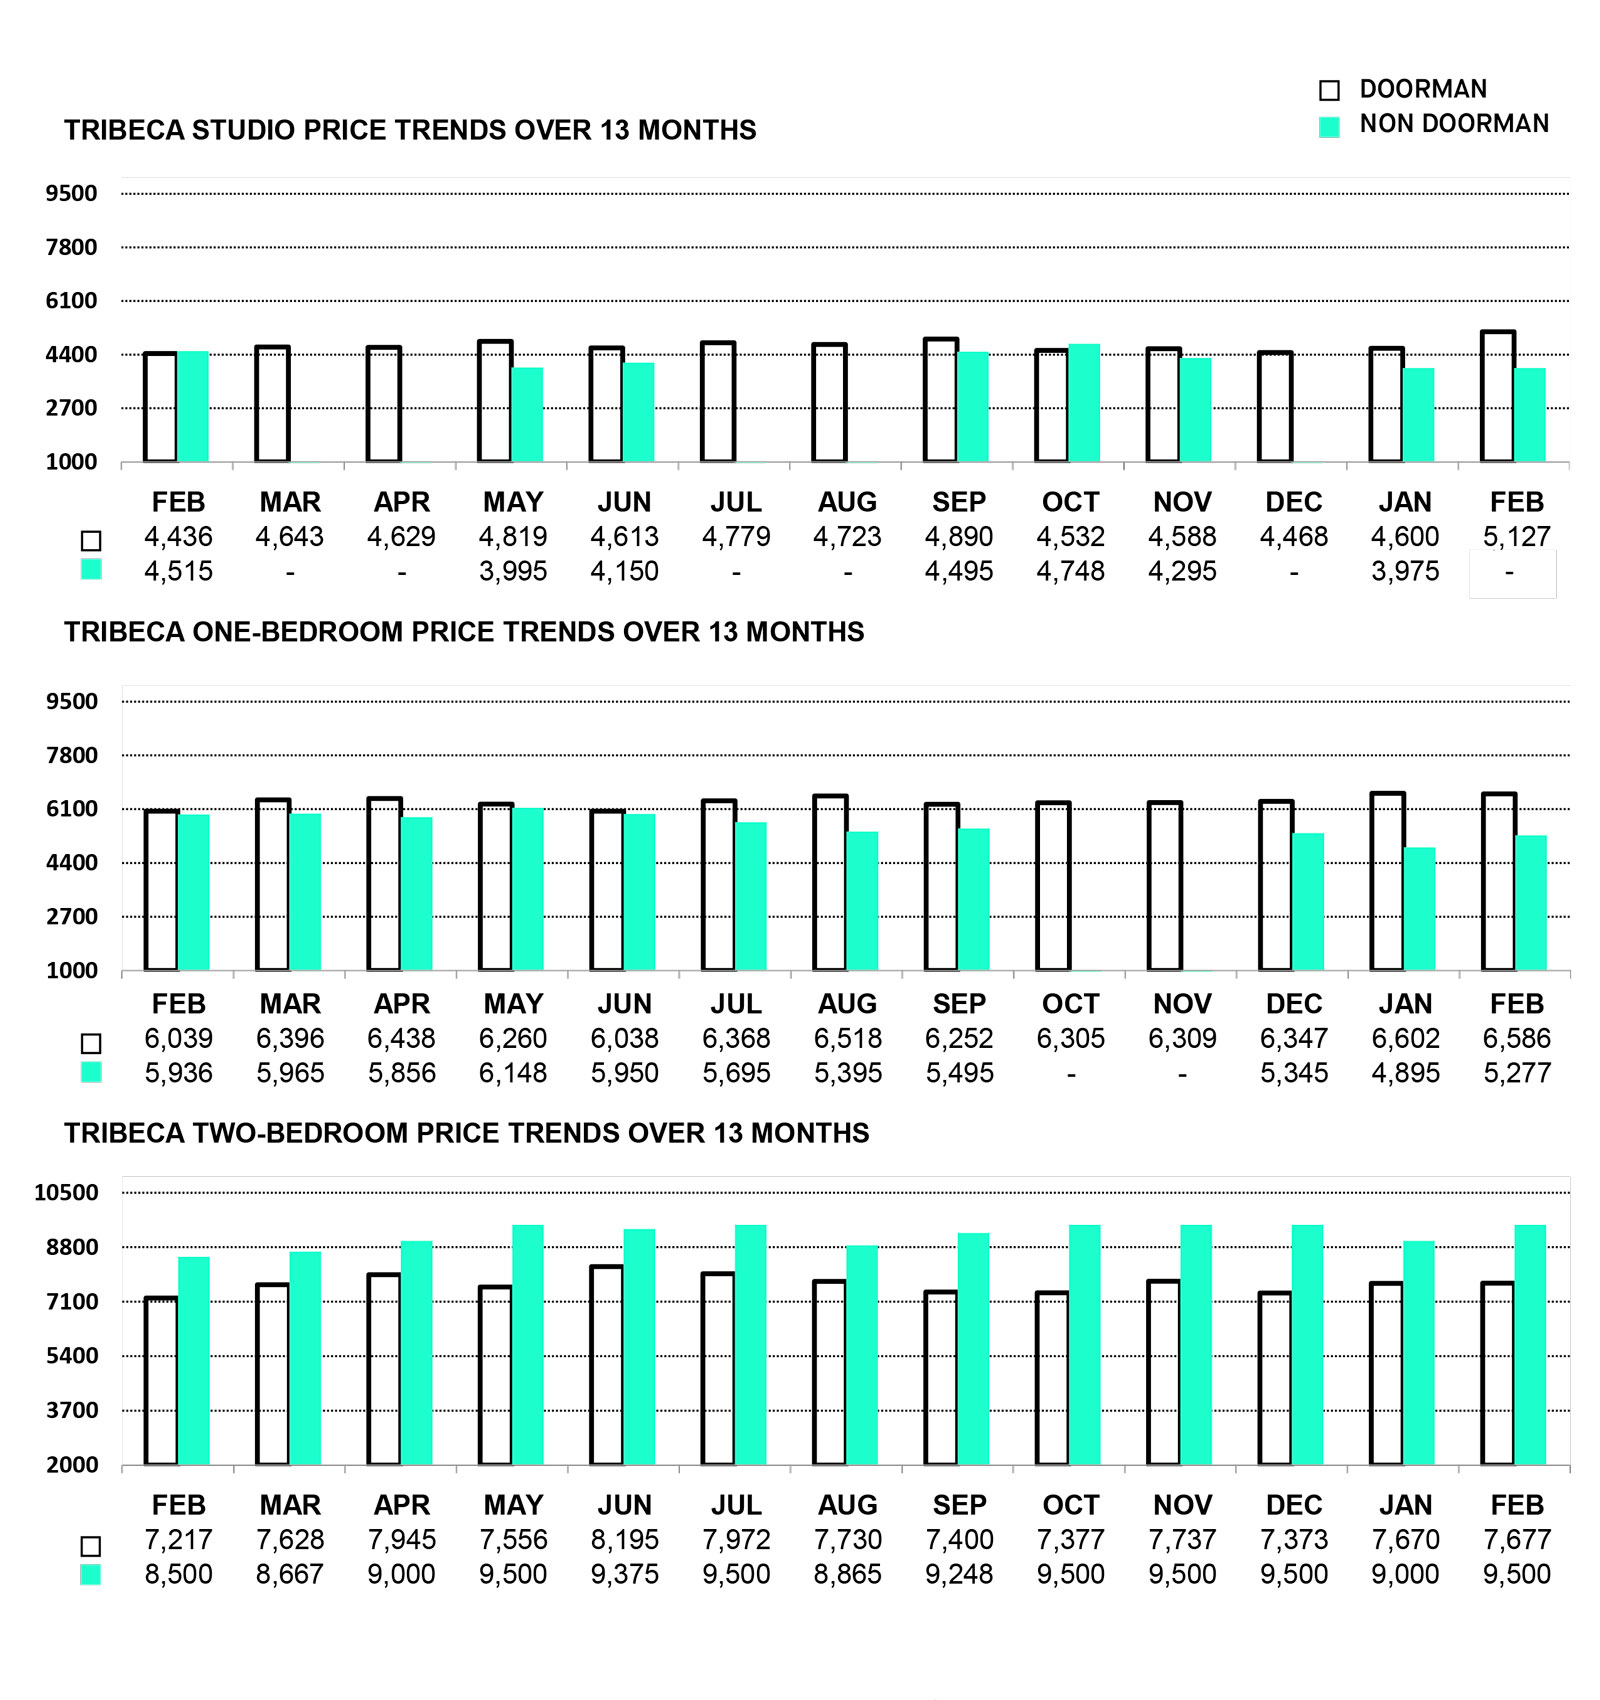
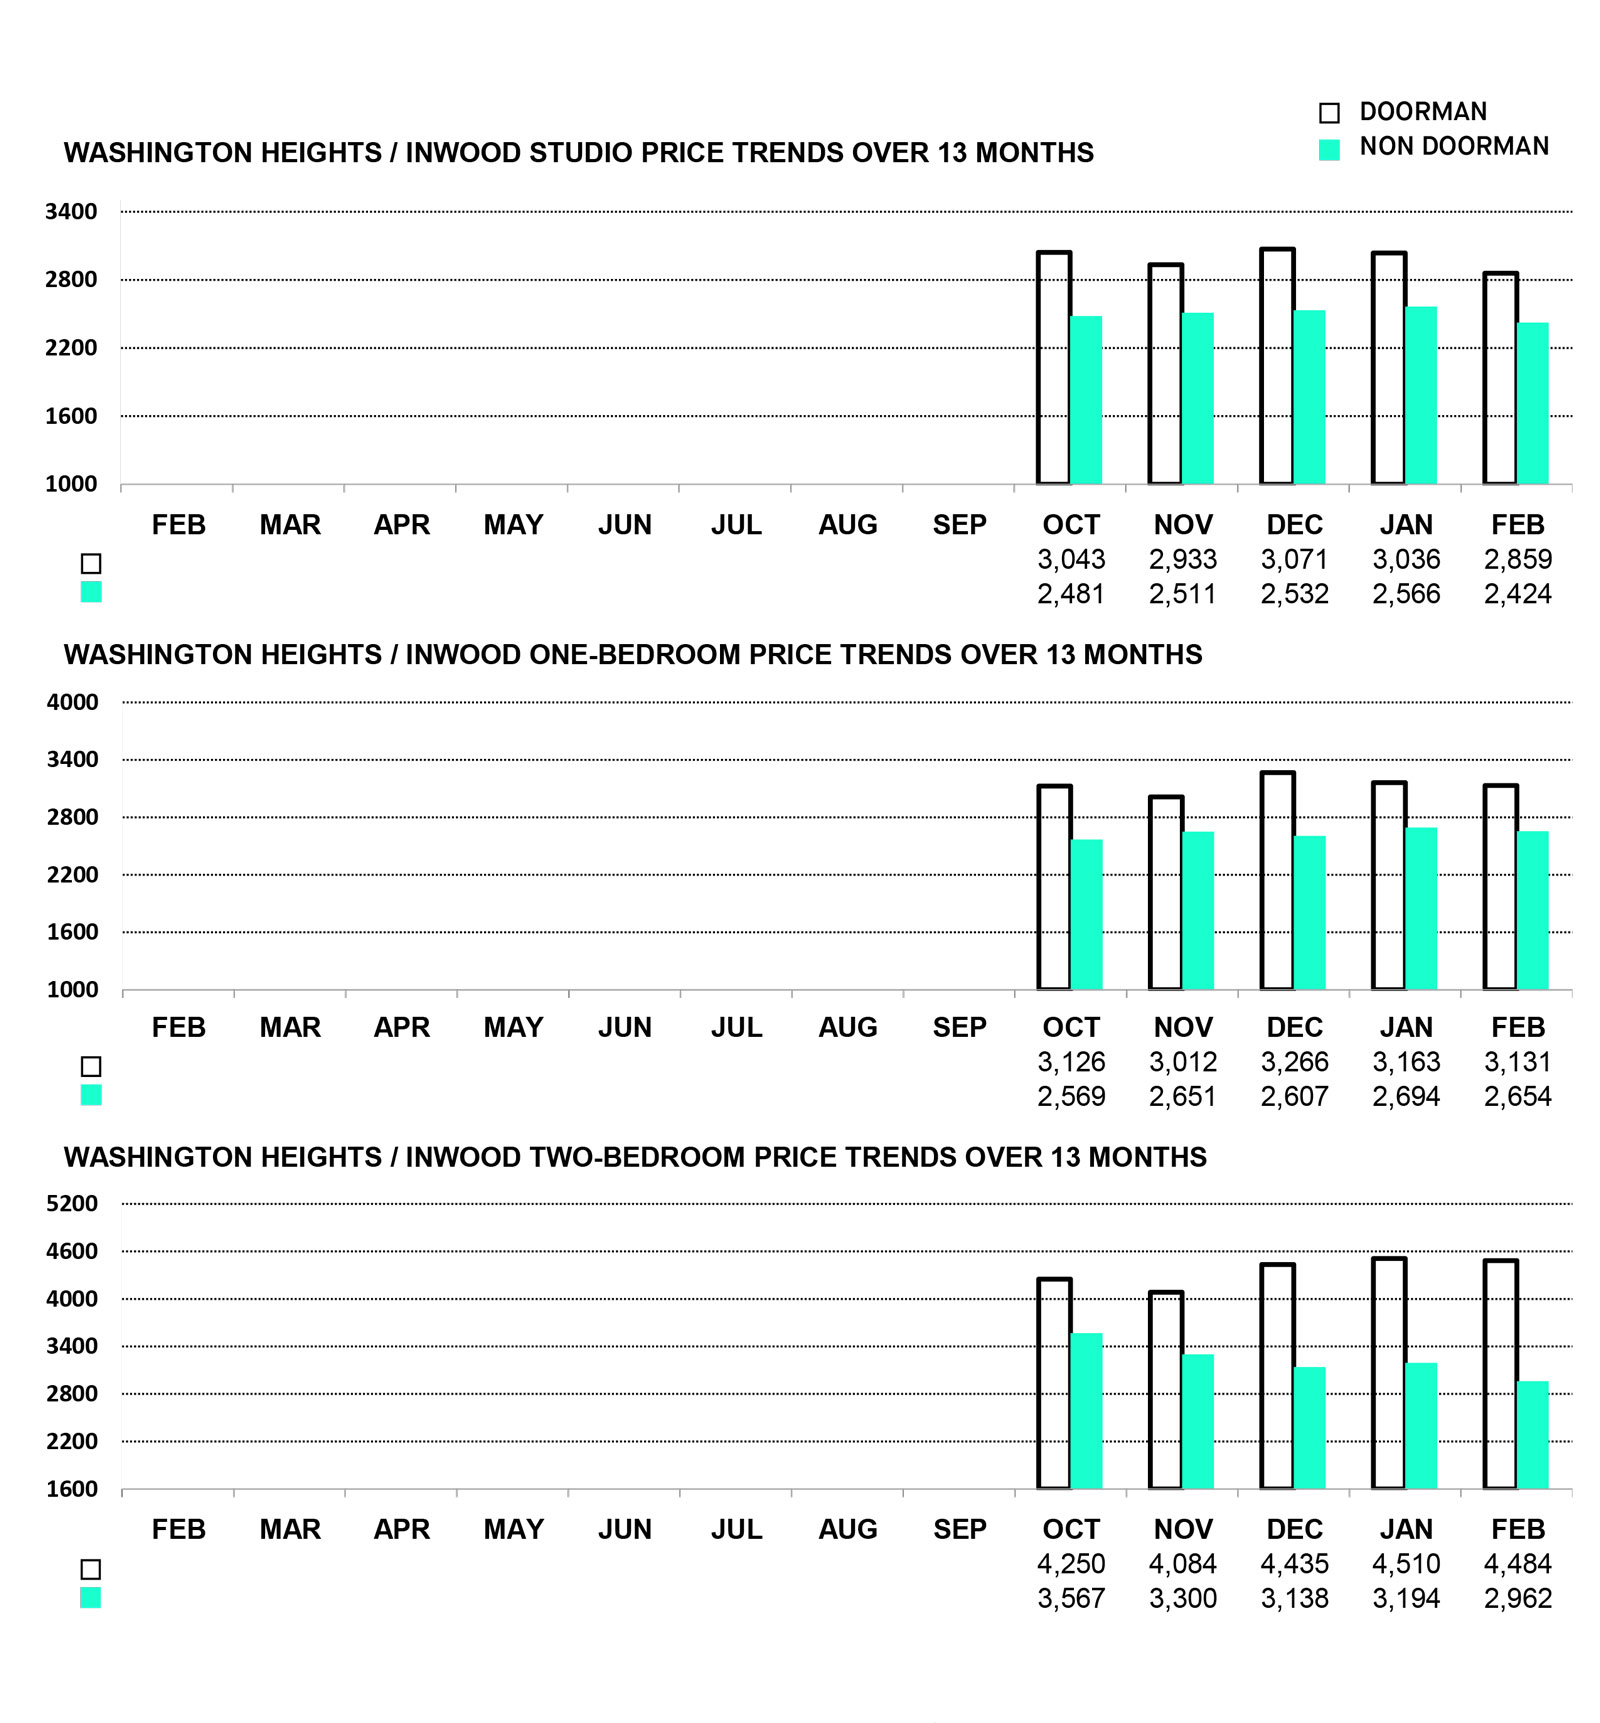
| Non-doorman one bedrooms | TriBeCa $5,277 | Washington Heights/ Inwood $2,654 |
| Non-doorman two bedrooms | TriBeCa $9,500 | Washington Heights/ Inwood $2,962 |
| TYPE | MOST EXPENSIVE | LEAST EXPENSIVE |
|---|---|---|
| Doorman studios | TriBeCa $5,127 | Washington Heights/ Inwood $2,859 |
| Doorman one bedrooms | Greenwich Village $7,334 | Washington Heights/ Inwood $3,131 |
| Doorman two bedrooms | Gramercy $8,498 | Washington Heights/ Inwood $4,484 |
WHERE PRICES DECREASED
CHELSEA
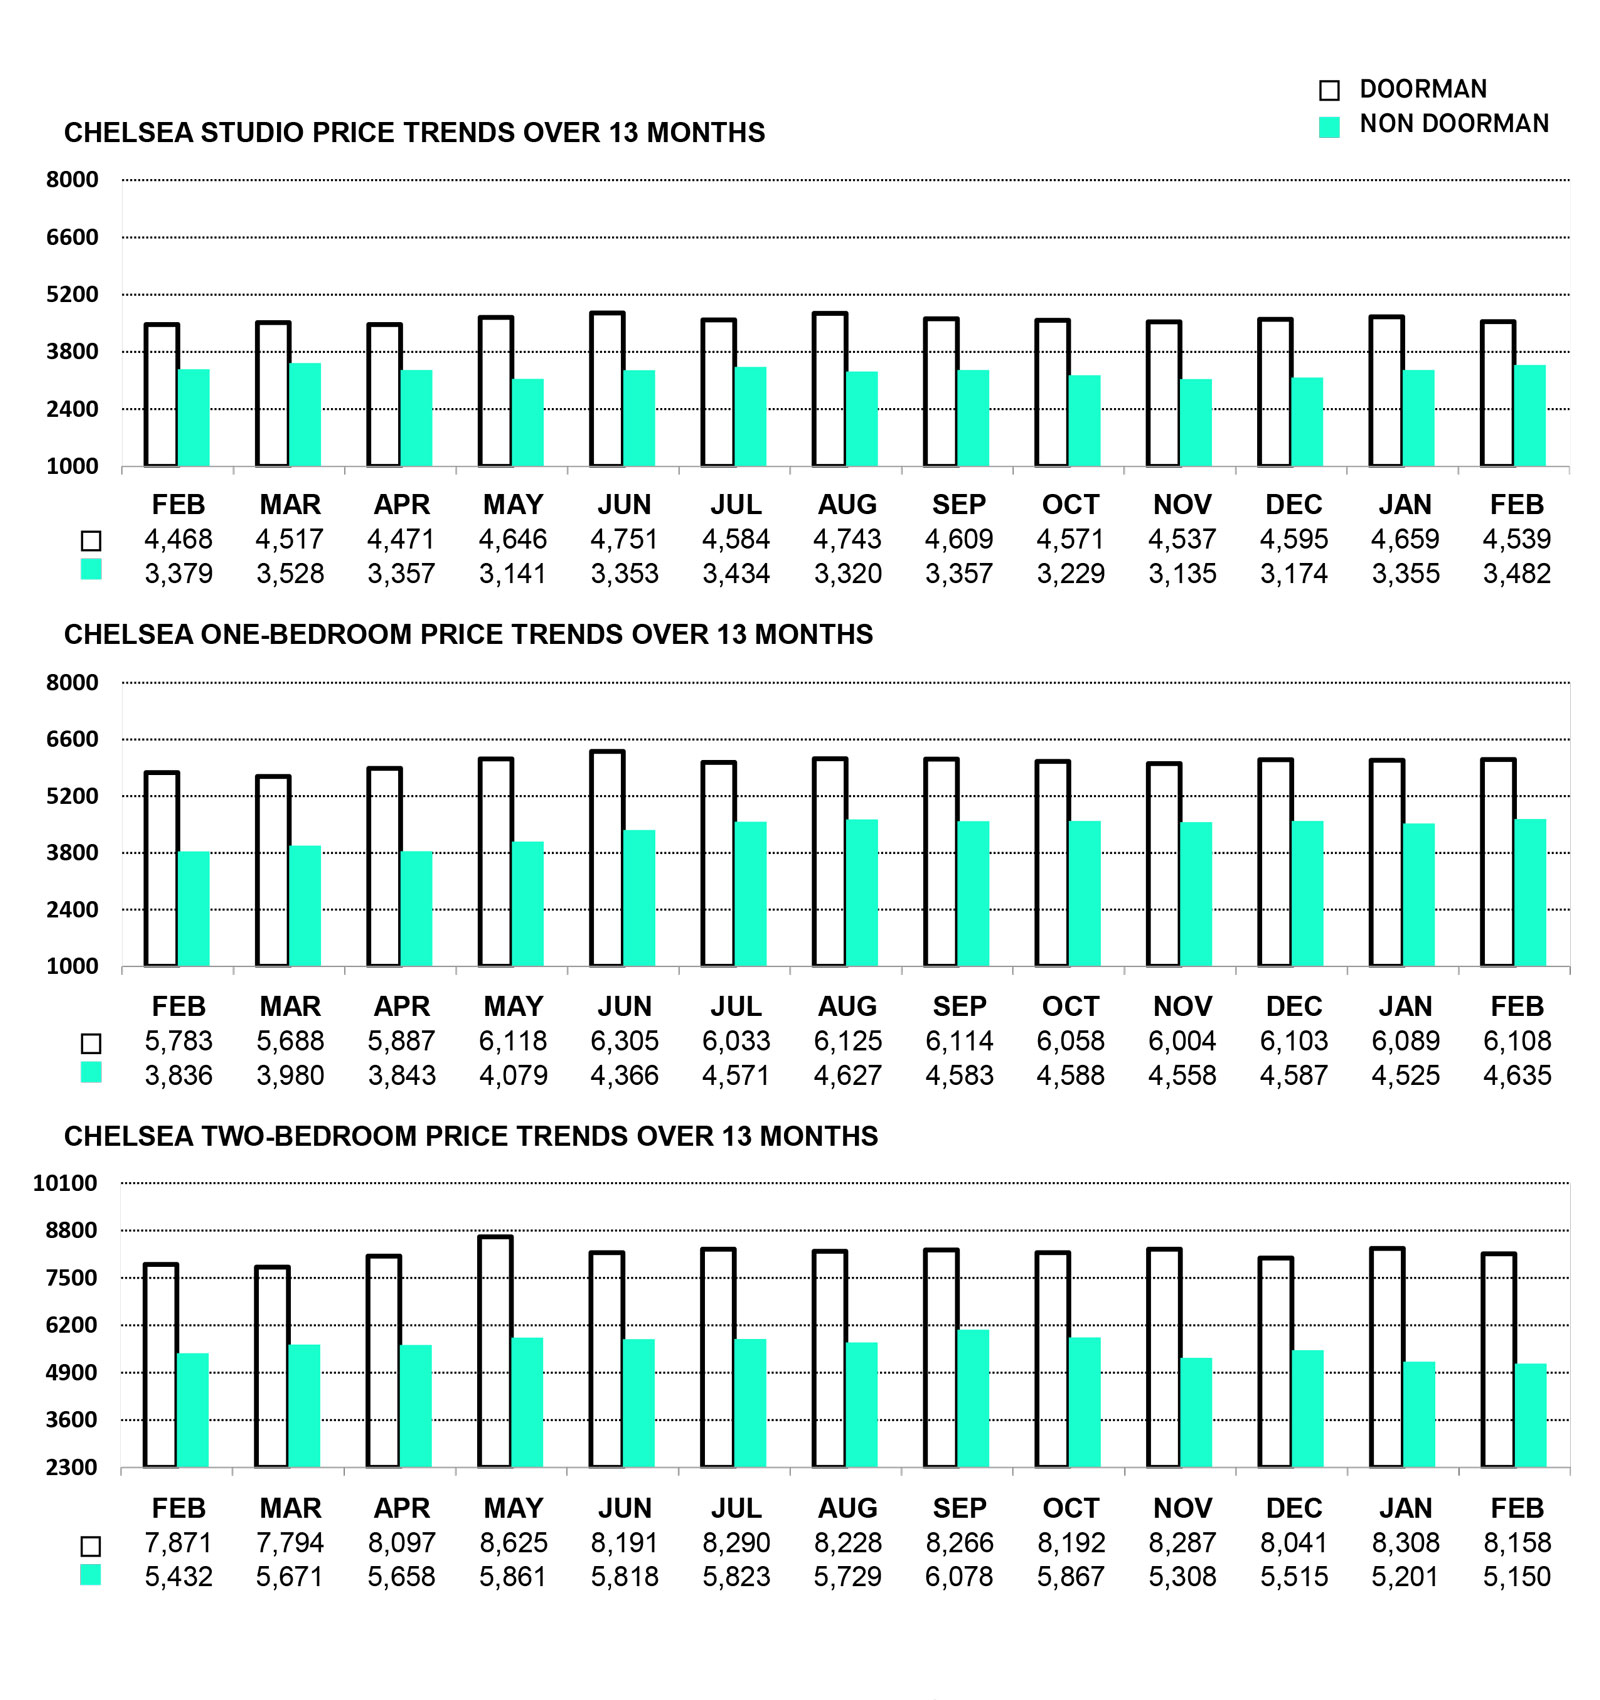
Non-Doorman Two-Bedroom -0.99%
Doorman Studios -2.58%
Doorman Two-Bedroom -1.81%
EAST VILLAGE
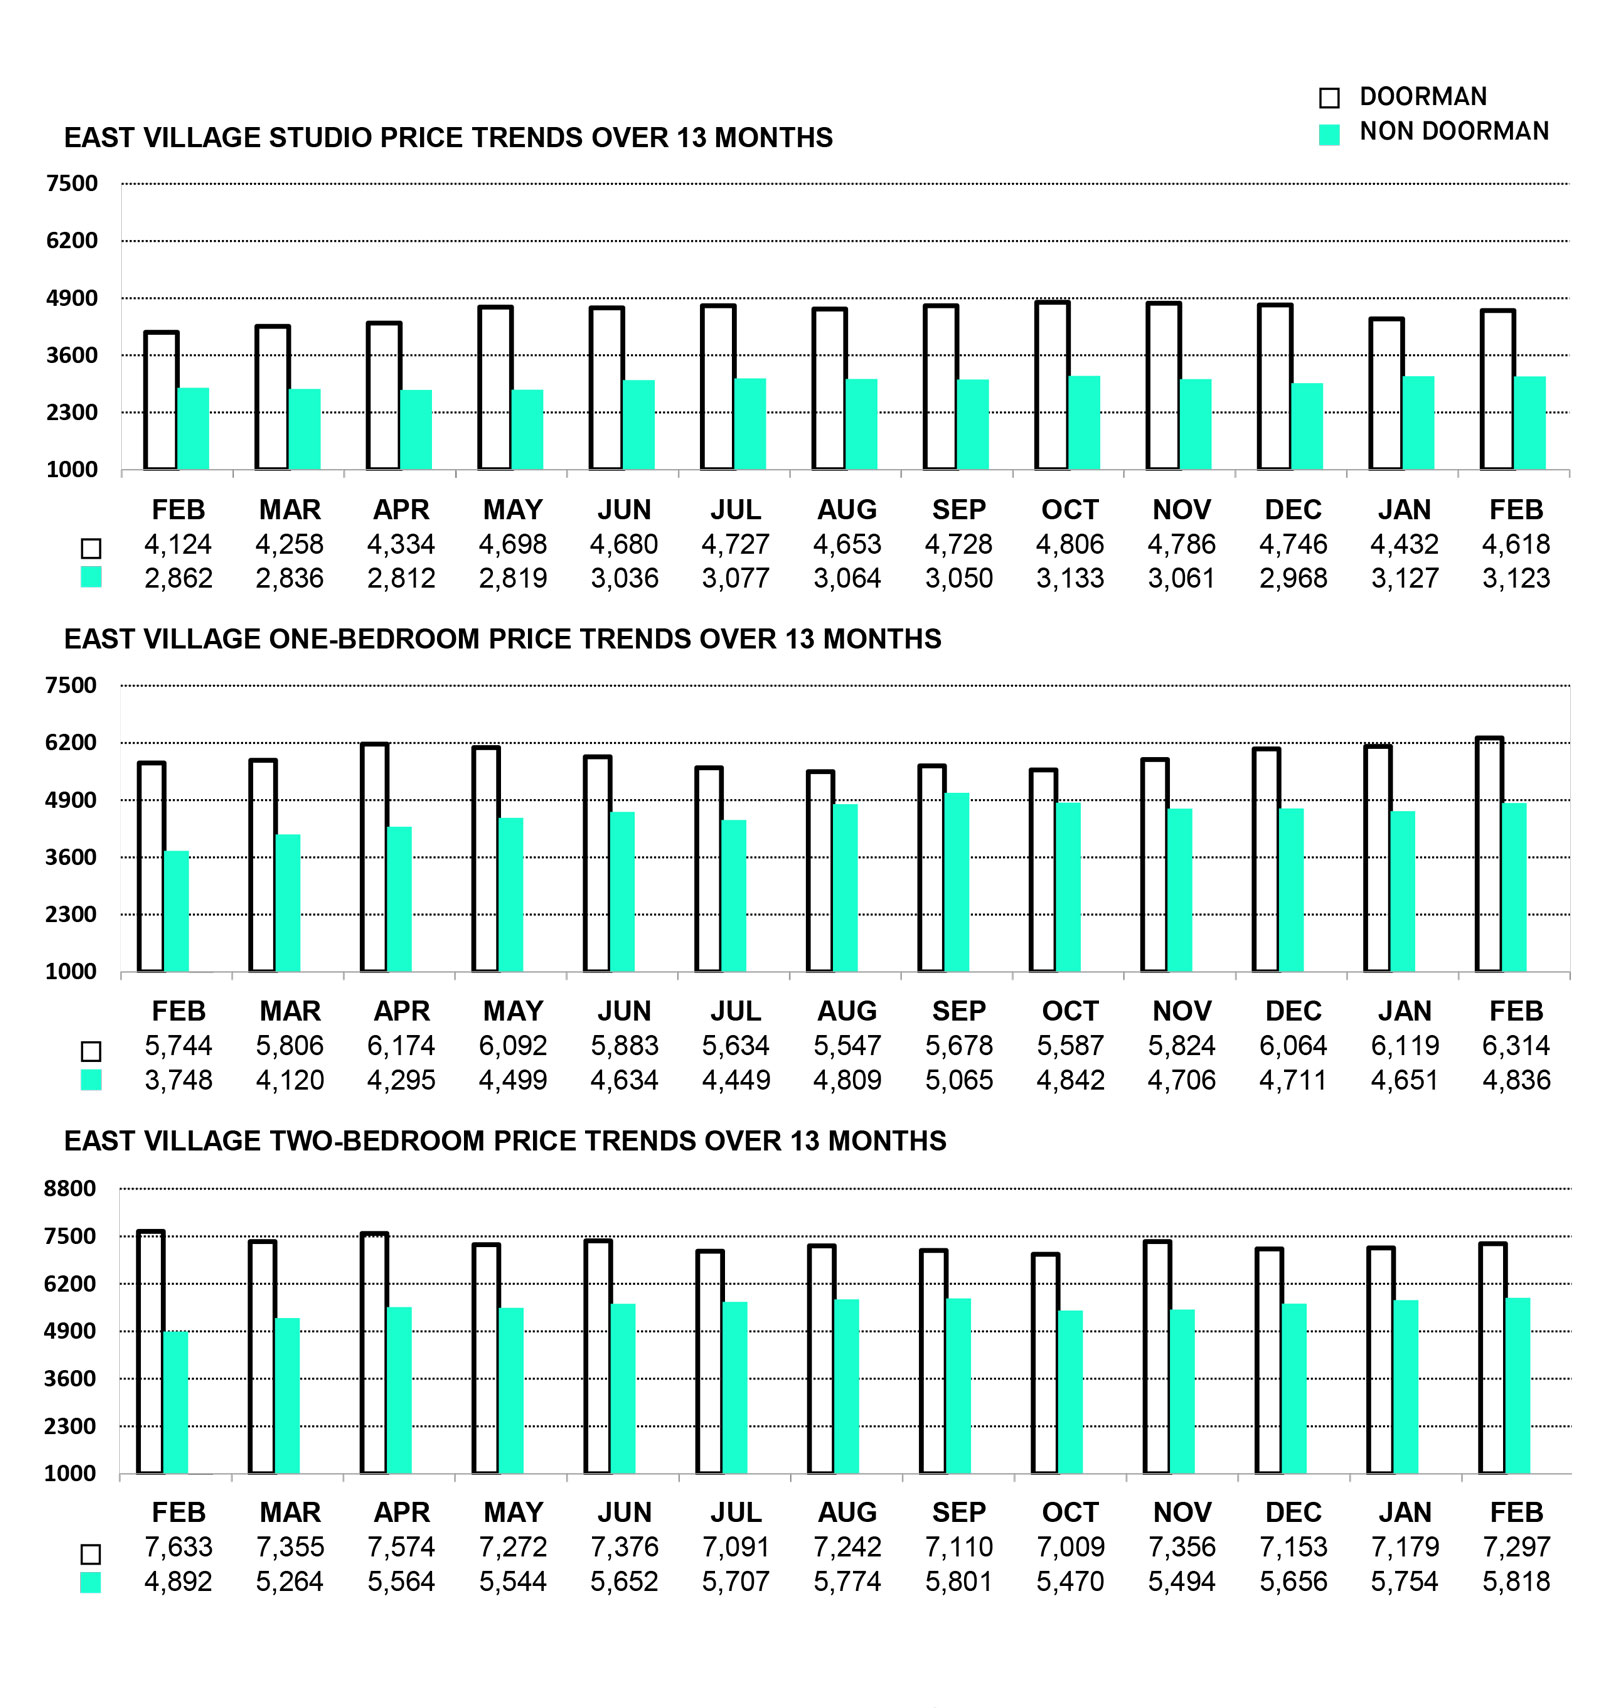
Non-Doorman Studios -0.14%
FINANCIAL DISTRICT
Doorman One-Bedroom -0.37%
GRAMERCY
Non-Doorman Studios -0.84%
Non-Doorman One-Bedroom -3.25%
Non-Doorman Two-Bedroom -1.98%
Doorman Two-Bedroom -3.58%
HARLEM
Doorman Studios -0.45%
MIDTOWN EAST
Doorman One-Bedroom -2.21%
MIDTOWN WEST
Non-Doorman One-Bedroom -1.64%
SOHO
Doorman One-Bedroom -7.76%
TRIBECA
Doorman One-Bedroom -0.24%
UPPER EAST SIDE
Doorman One-Bedroom -1.26%
UPPER WEST SIDE
Non-Doorman Studios -2.15%
Non-Doorman One-Bedroom -4.44%
Doorman Studios -1.22%
WASHINGTON HEIGHTS / INWOOD
Non-Doorman Studios -5.51%
Non-Doorman One-Bedroom -1.46%
Non-Doorman Two-Bedroom -7.28%
Doorman Studios -5.83%
Doorman One-Bedroom -1.00%
Doorman Two-Bedroom -0.58%
WHERE PRICES INCREASED
BATTERY PARK CITY
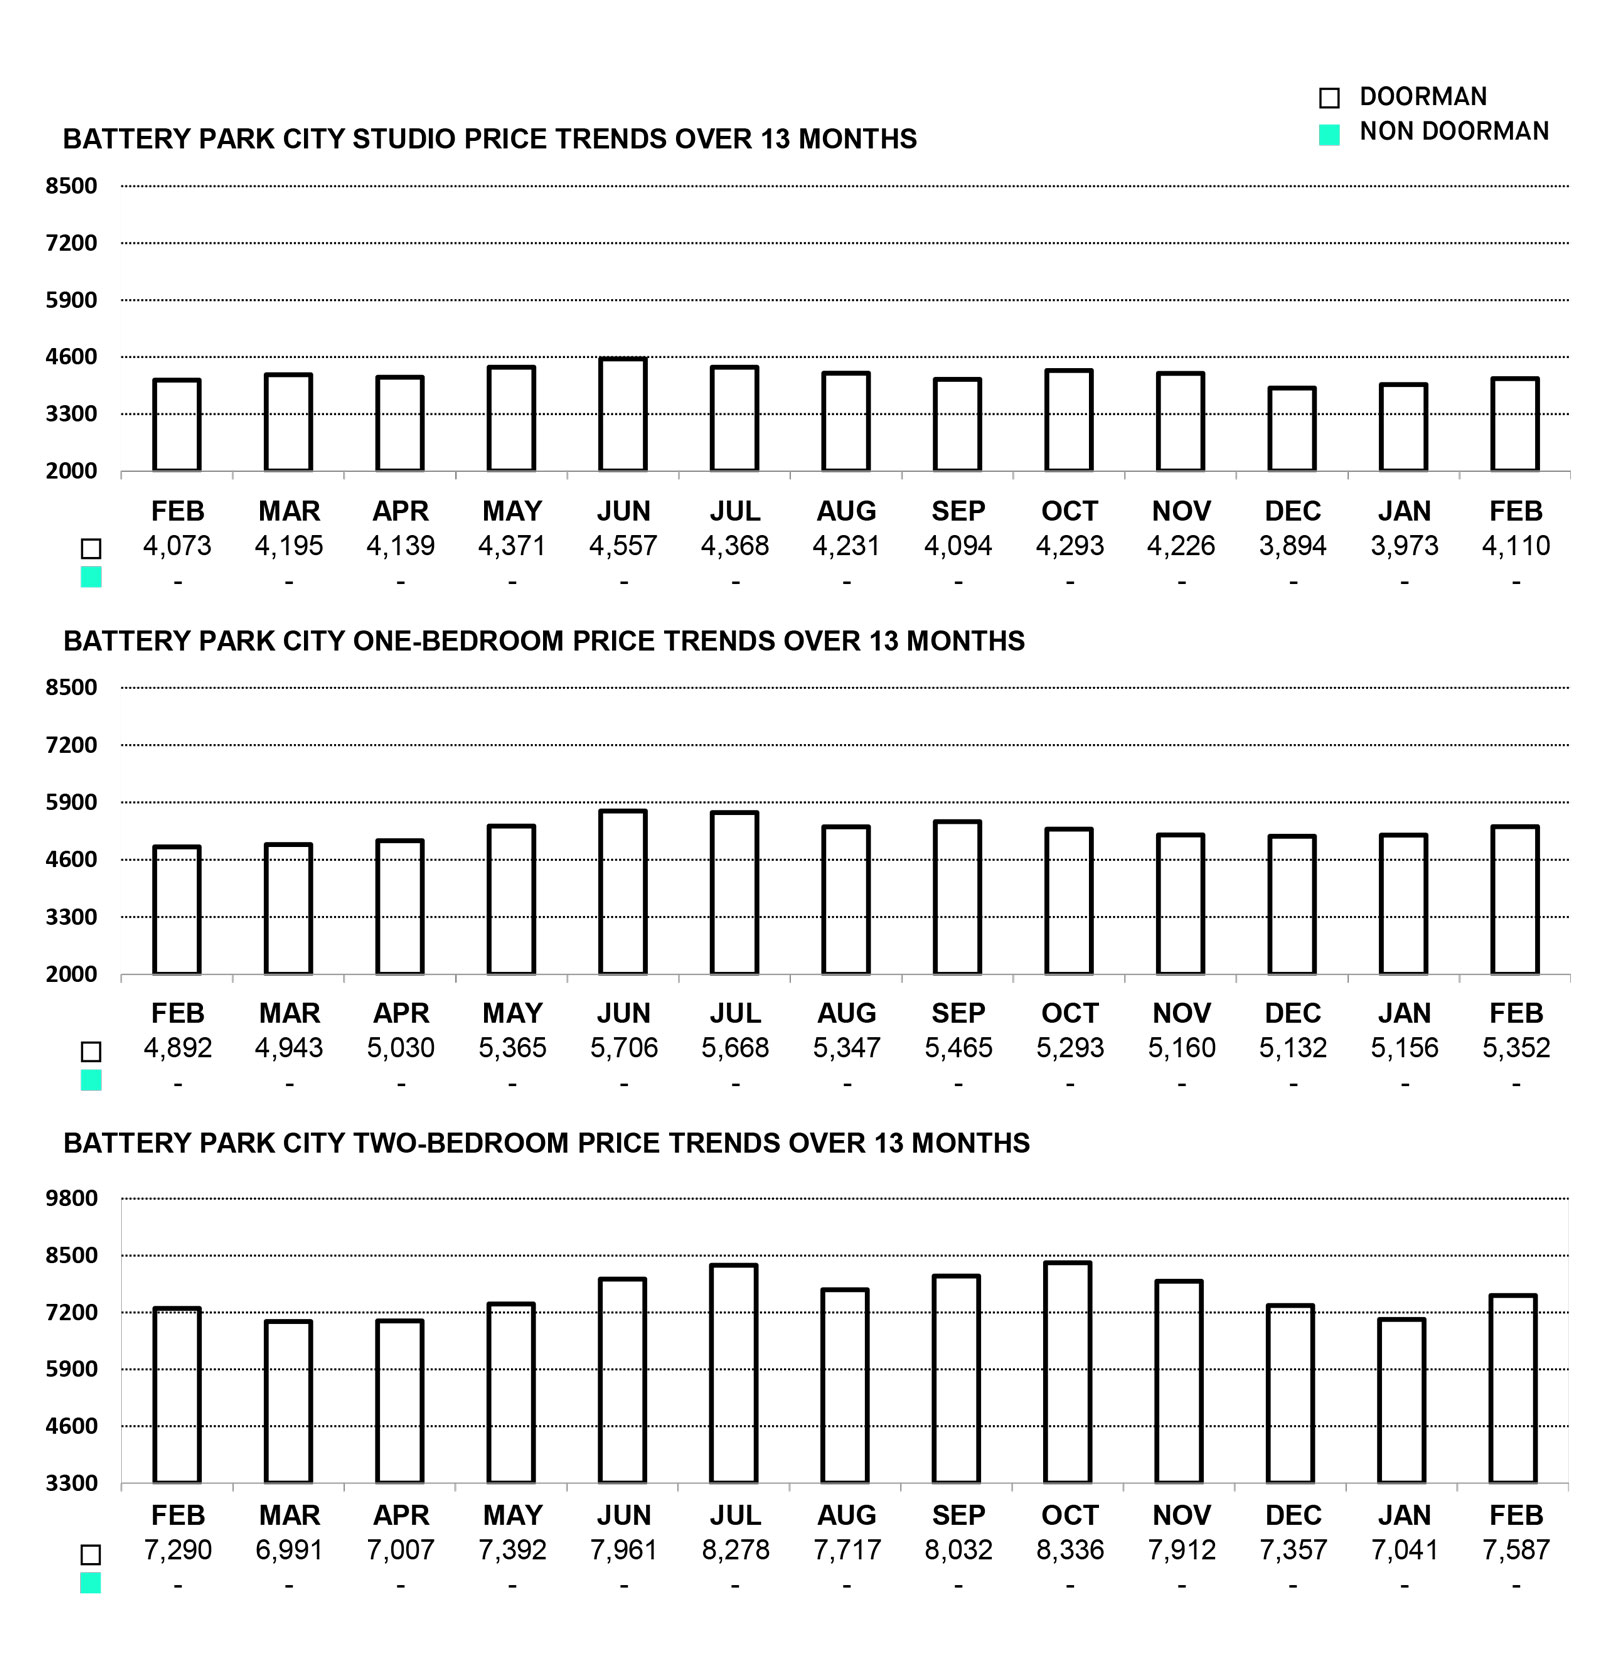
Doorman Studios 3.44%
Doorman One-Bedroom 3.79%
Doorman Two-Bedroom 7.76%
CHELSEA
Non-Doorman Studios 3.78%
Non-Doorman One-Bedroom 2.42%
Doorman One-Bedroom 0.31%
EAST VILLAGE
Non-Doorman One-Bedroom 3.97%
Non-Doorman Two-Bedroom 1.11%
Doorman Studios 4.19%
Doorman One-Bedroom 3.19%
Doorman Two-Bedroom 1.65%
FINANCIAL DISTRICT
Non-Doorman Studios 0.00%
Non-Doorman One-Bedroom 6.76%
Non-Doorman Two-Bedroom 1.58%
Doorman Studios 1.39%
Doorman Two-Bedroom 3.01%
GRAMERCY
Doorman Studios 3.24%
Doorman One-Bedroom 3.69%
GREENWICH VILLAGE
Non-Doorman Studios 2.46%
Non-Doorman One-Bedroom 6.72%
Non-Doorman Two-Bedroom 7.09%
Doorman Studios 1.17%
Doorman One-Bedroom 4.89%
Doorman Two-Bedroom 1.28%
HARLEM
Non-Doorman Studios 2.58%
Non-Doorman One-Bedroom 0.96%
Non-Doorman Two-Bedroom 1.29%
Doorman One-Bedroom 1.99%
Doorman Two-Bedroom 0.11%
LOWER EAST SIDE
Non-Doorman Studios 5.37%
Non-Doorman One-Bedroom 8.30%
Non-Doorman Two-Bedroom 2.51%
Doorman Studios 0.56%
Doorman One-Bedroom 3.20%
Doorman Two-Bedroom 5.93%
MIDTOWN EAST
Non-Doorman Studios 6.39%
Non-Doorman One-Bedroom 3.81%
Non-Doorman Two-Bedroom 3.29%
Doorman Studios 8.27%
Doorman Two-Bedroom 4.34%
MIDTOWN WEST
Non-Doorman Studios 1.87%
Non-Doorman Two-Bedroom 3.72%
Doorman Studios 3.21%
Doorman One-Bedroom 0.86%
Doorman Two-Bedroom 2.35%
MURRAY HILL
Non-Doorman Studios 4.34%
Non-Doorman One-Bedroom 5.59%
Non-Doorman Two-Bedroom 7.02%
Doorman Studios 1.11%
Doorman One-Bedroom 1.06%
Doorman Two-Bedroom 3.78%
SOHO
Non-Doorman Studios 3.08%
Non-Doorman One-Bedroom 4.31%
Non-Doorman Two-Bedroom 2.49%
Doorman Studio 0.00%
Doorman Two-Bedroom 0.00%
TRIBECA
Non-Doorman Studios 0.00%
Non-Doorman One-Bedroom 0.00%
Non-Doorman Two-Bedroom 5.56%
Doorman Studios 11.45%
Doorman Two-Bedroom 0.09%
UPPER EAST SIDE
Non-Doorman Studios 0.81%
Non-Doorman One-Bedroom 2.29%
Non-Doorman Two-Bedroom 0.89%
Doorman Studios 0.40%
Doorman Two-Bedroom 5.84%
UPPER WEST SIDE
Non-Doorman Two-Bedroom 0.82%
Doorman One-Bedroom 4.27%
Doorman Two-Bedroom 2.63%
MANHATTAN AVERAGE PRICE
MANHATTAN AVERAGE PRICE
MANHATTAN AVERAGE PRICE
A QUICK LOOK
year over year PRICE CHANGE BY NEIGHBORHOOD

YEAR OVER YEAR Price change
MANHATTAN RENTS: FEBRUARY 2025 VS. FEBRUARY 2026

| TYPE | FEBRUARY 2025 | FEBRUARY 2026 | CHANGE |
|---|---|---|---|
| Non-doorman studios | $3,012 | $3,142 | 4.31% |
| Non-doorman one bedrooms | $3,818 | $4,135 | 8.31% |
| Non-doorman two bedrooms | $4,926 | $5,368 | 8.97% |
| TYPE | FEBRUARY 2025 | FEBRUARY 2026 | CHANGE |
|---|---|---|---|
| Doorman studios | $4,128 | $4,215 | 2.10% |
| Doorman one bedrooms | $5,411 | $5,609 | 3.66% |
| Doorman two bedrooms | $7,080 | $7,290 | 2.97% |
MANHATTAN PRICE TRENDS
BATTERY PARK CITY PRICE TRENDS
THE AVERAGE RENTAL PRICE IN BATTERY PARK CITY INCREASED BY 5.43%.
CHELSEA PRICE TRENDS
MONTH-OVER-MONTH, AVERAGE DOORMAN RENTAL PRICES HAVE DECREASED BY 1.31%, WHILE NON-DOORMAN RENTS INCREASED BY 1.41%.
EAST VILLAGE PRICE TRENDS
DOORMAN RENTS INCREASED THIS PAST MONTH BY 2.82%, AND NON-DOORMAN RENTS INCREASED BY 1.81%.
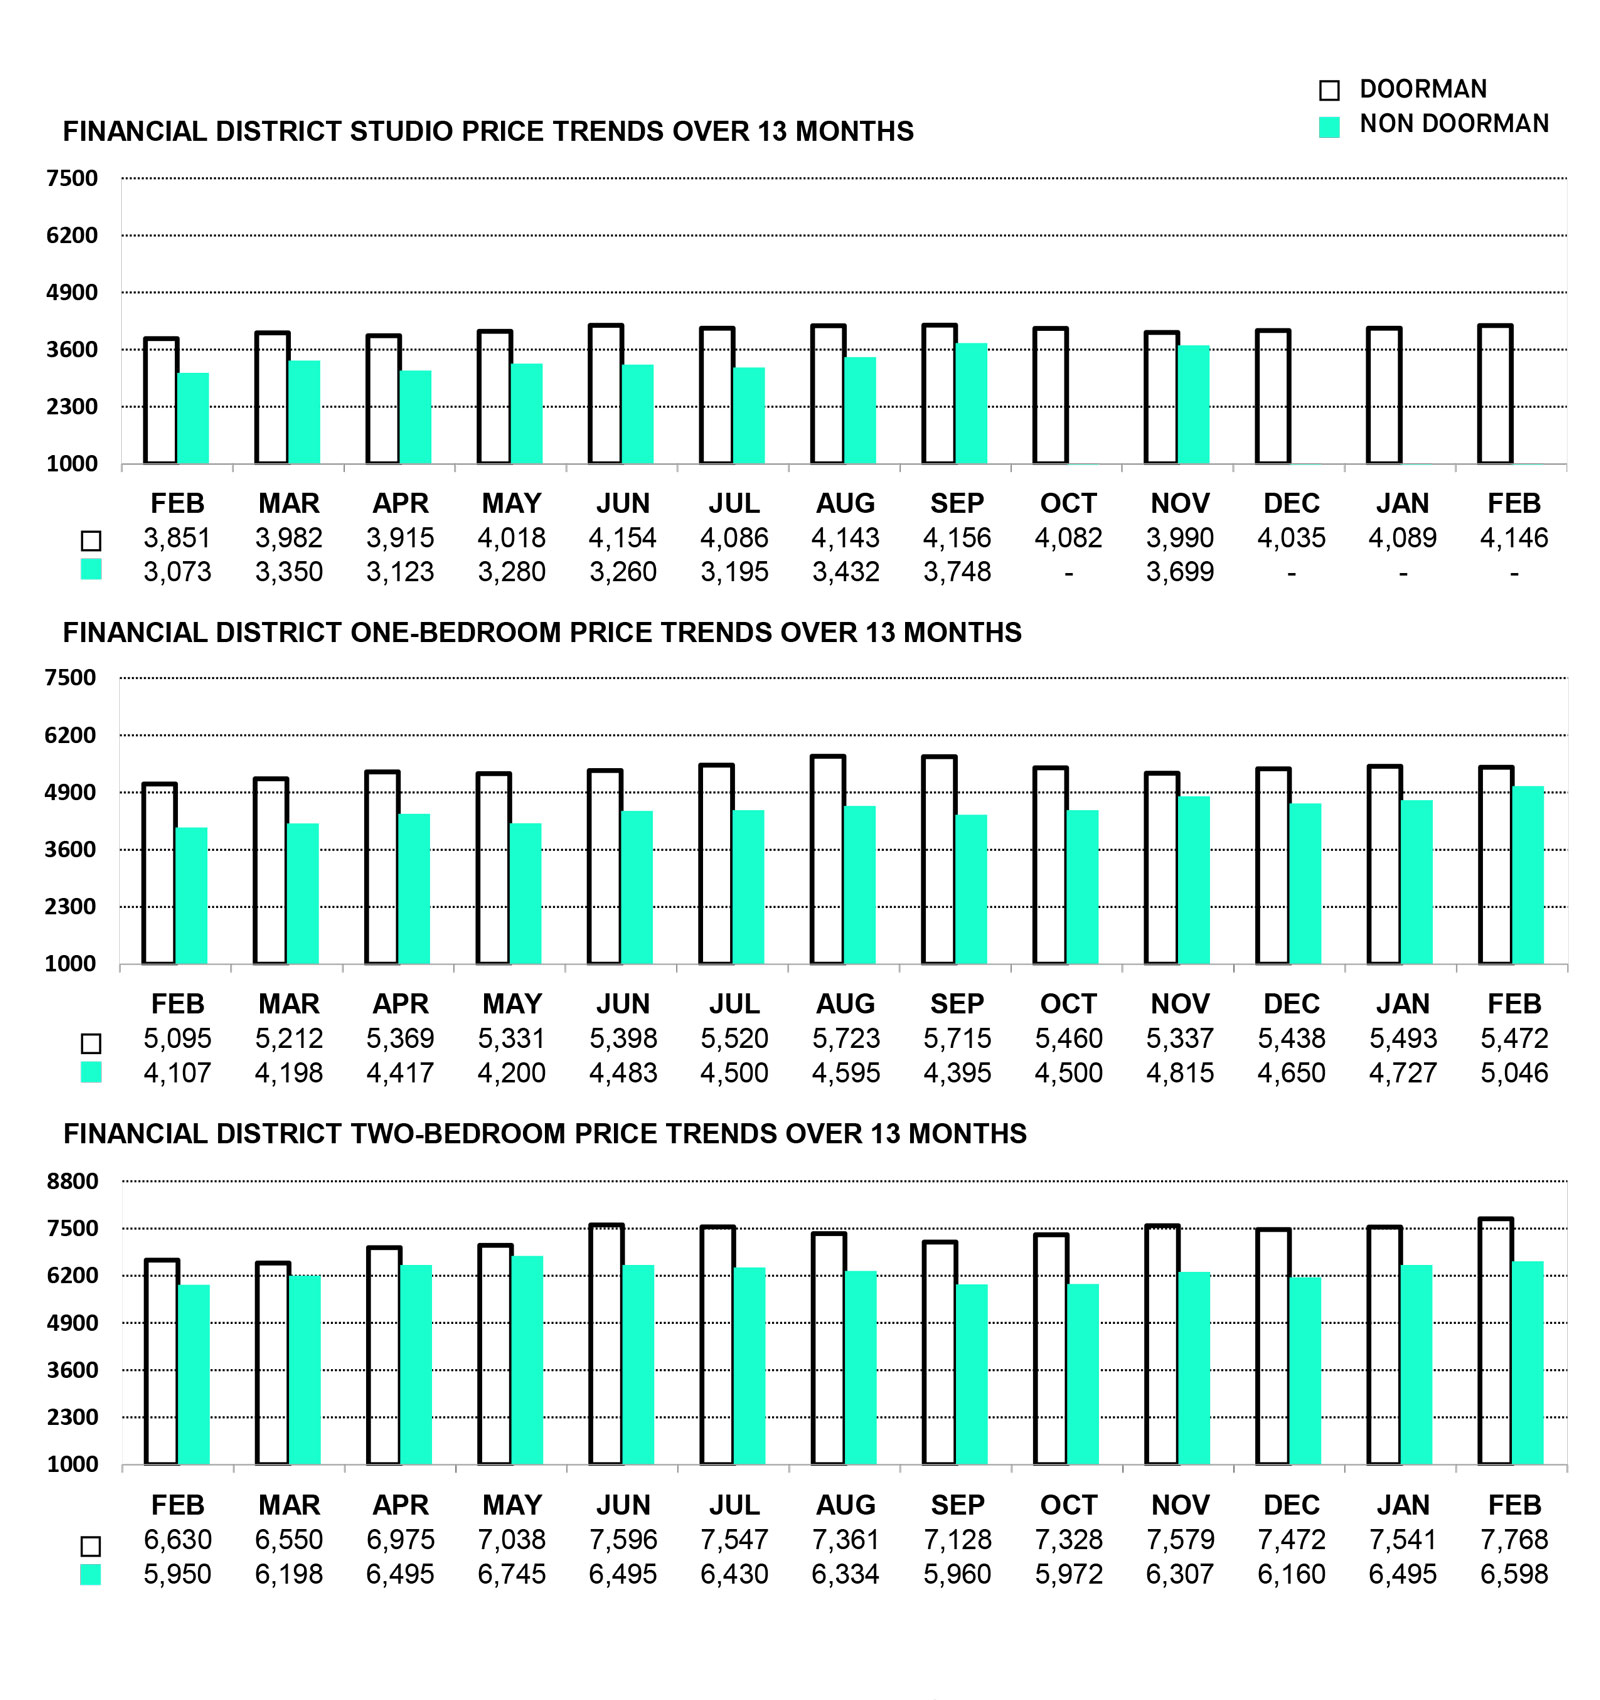
FINANCIAL DISTRICT PRICE TRENDS
THE AVERAGE RENTAL DOORMAN PRICE INCREASED THIS PAST MONTH BY 1.53%, AND NON-DOORMAN RENTS INCREASED BY 3.76%.
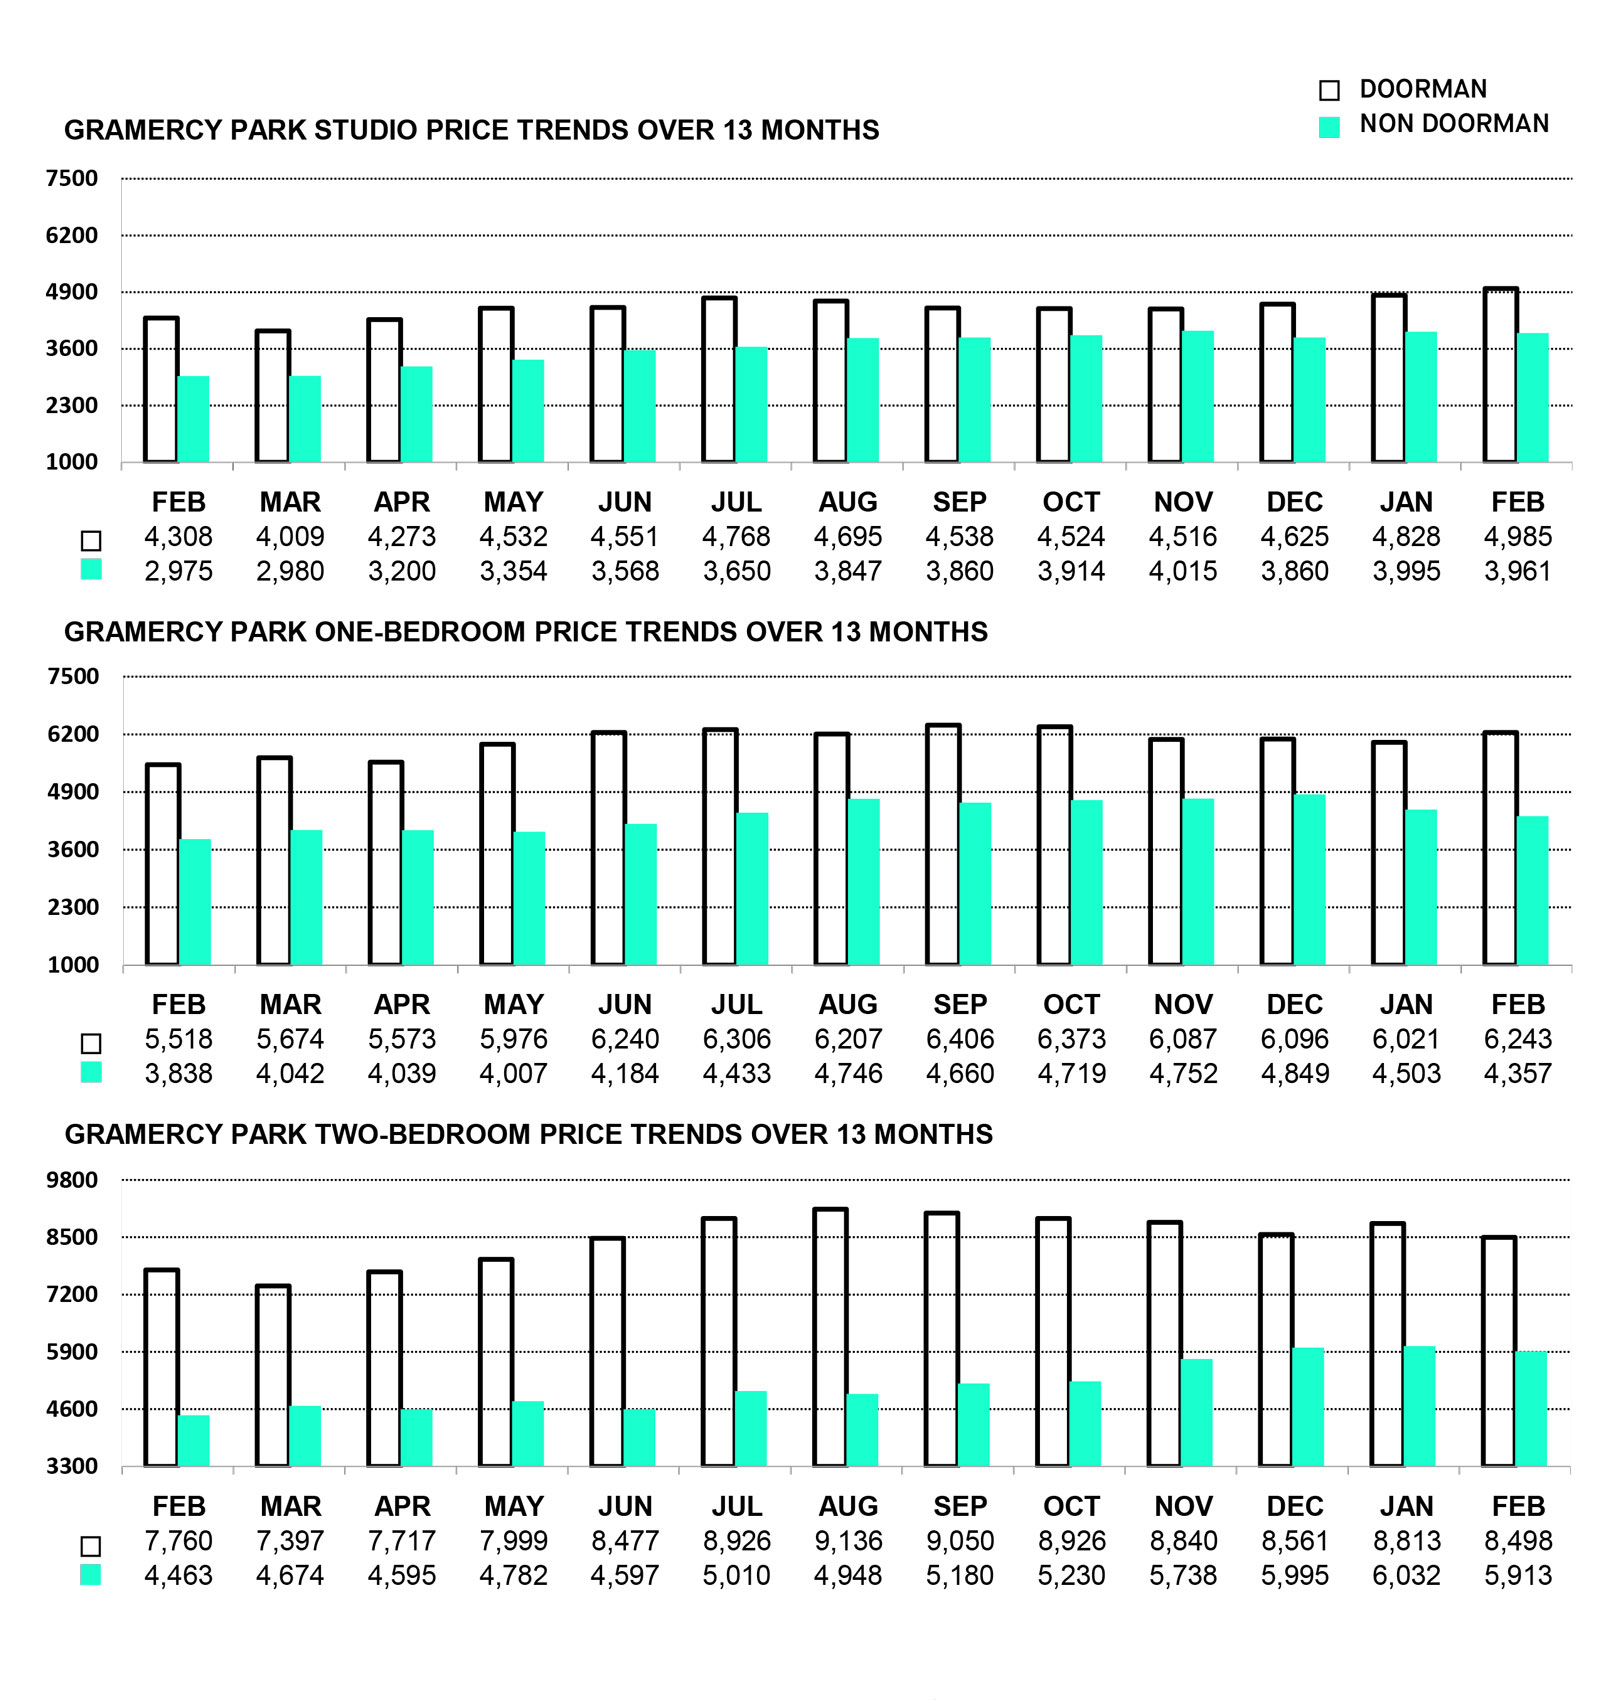
GRAMERCY PARK PRICE TRENDS
THIS PAST MONTH, THE AVERAGE DOORMAN RENTS SLIGHTLY INCREASED BY JUST 0.32%, WHILE NON-DOORMAN RENTS DECREASED BY 2.06%.
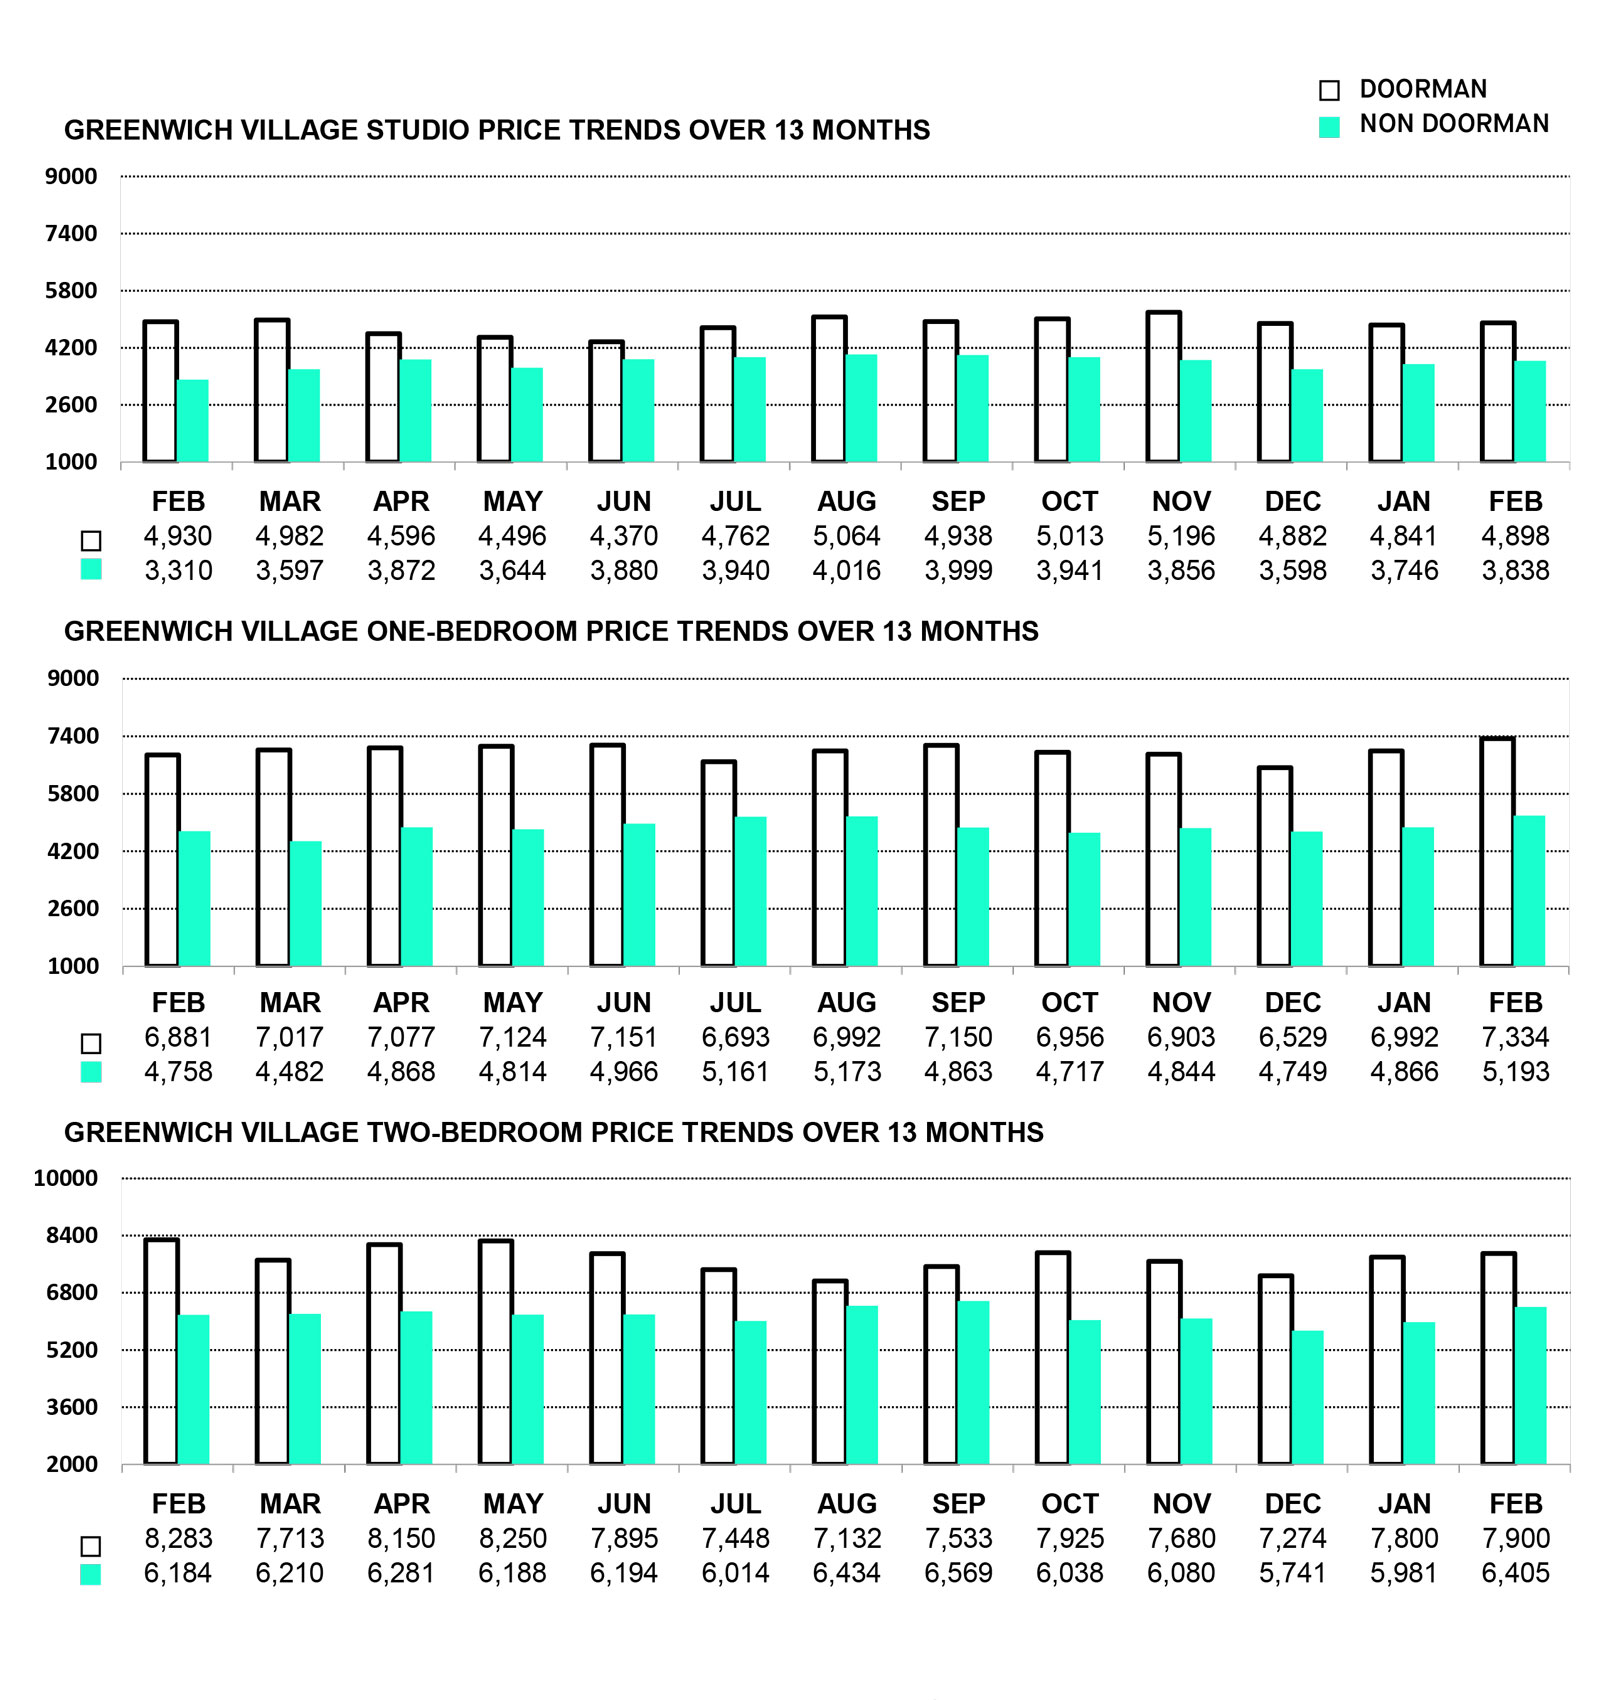
GREENWICH VILLAGE PRICE TRENDS
DOORMAN RENTS INCREASED BY 2.54% THIS PAST MONTH, AND NON-DOORMAN RENTS INCREASED BY 5.78%.
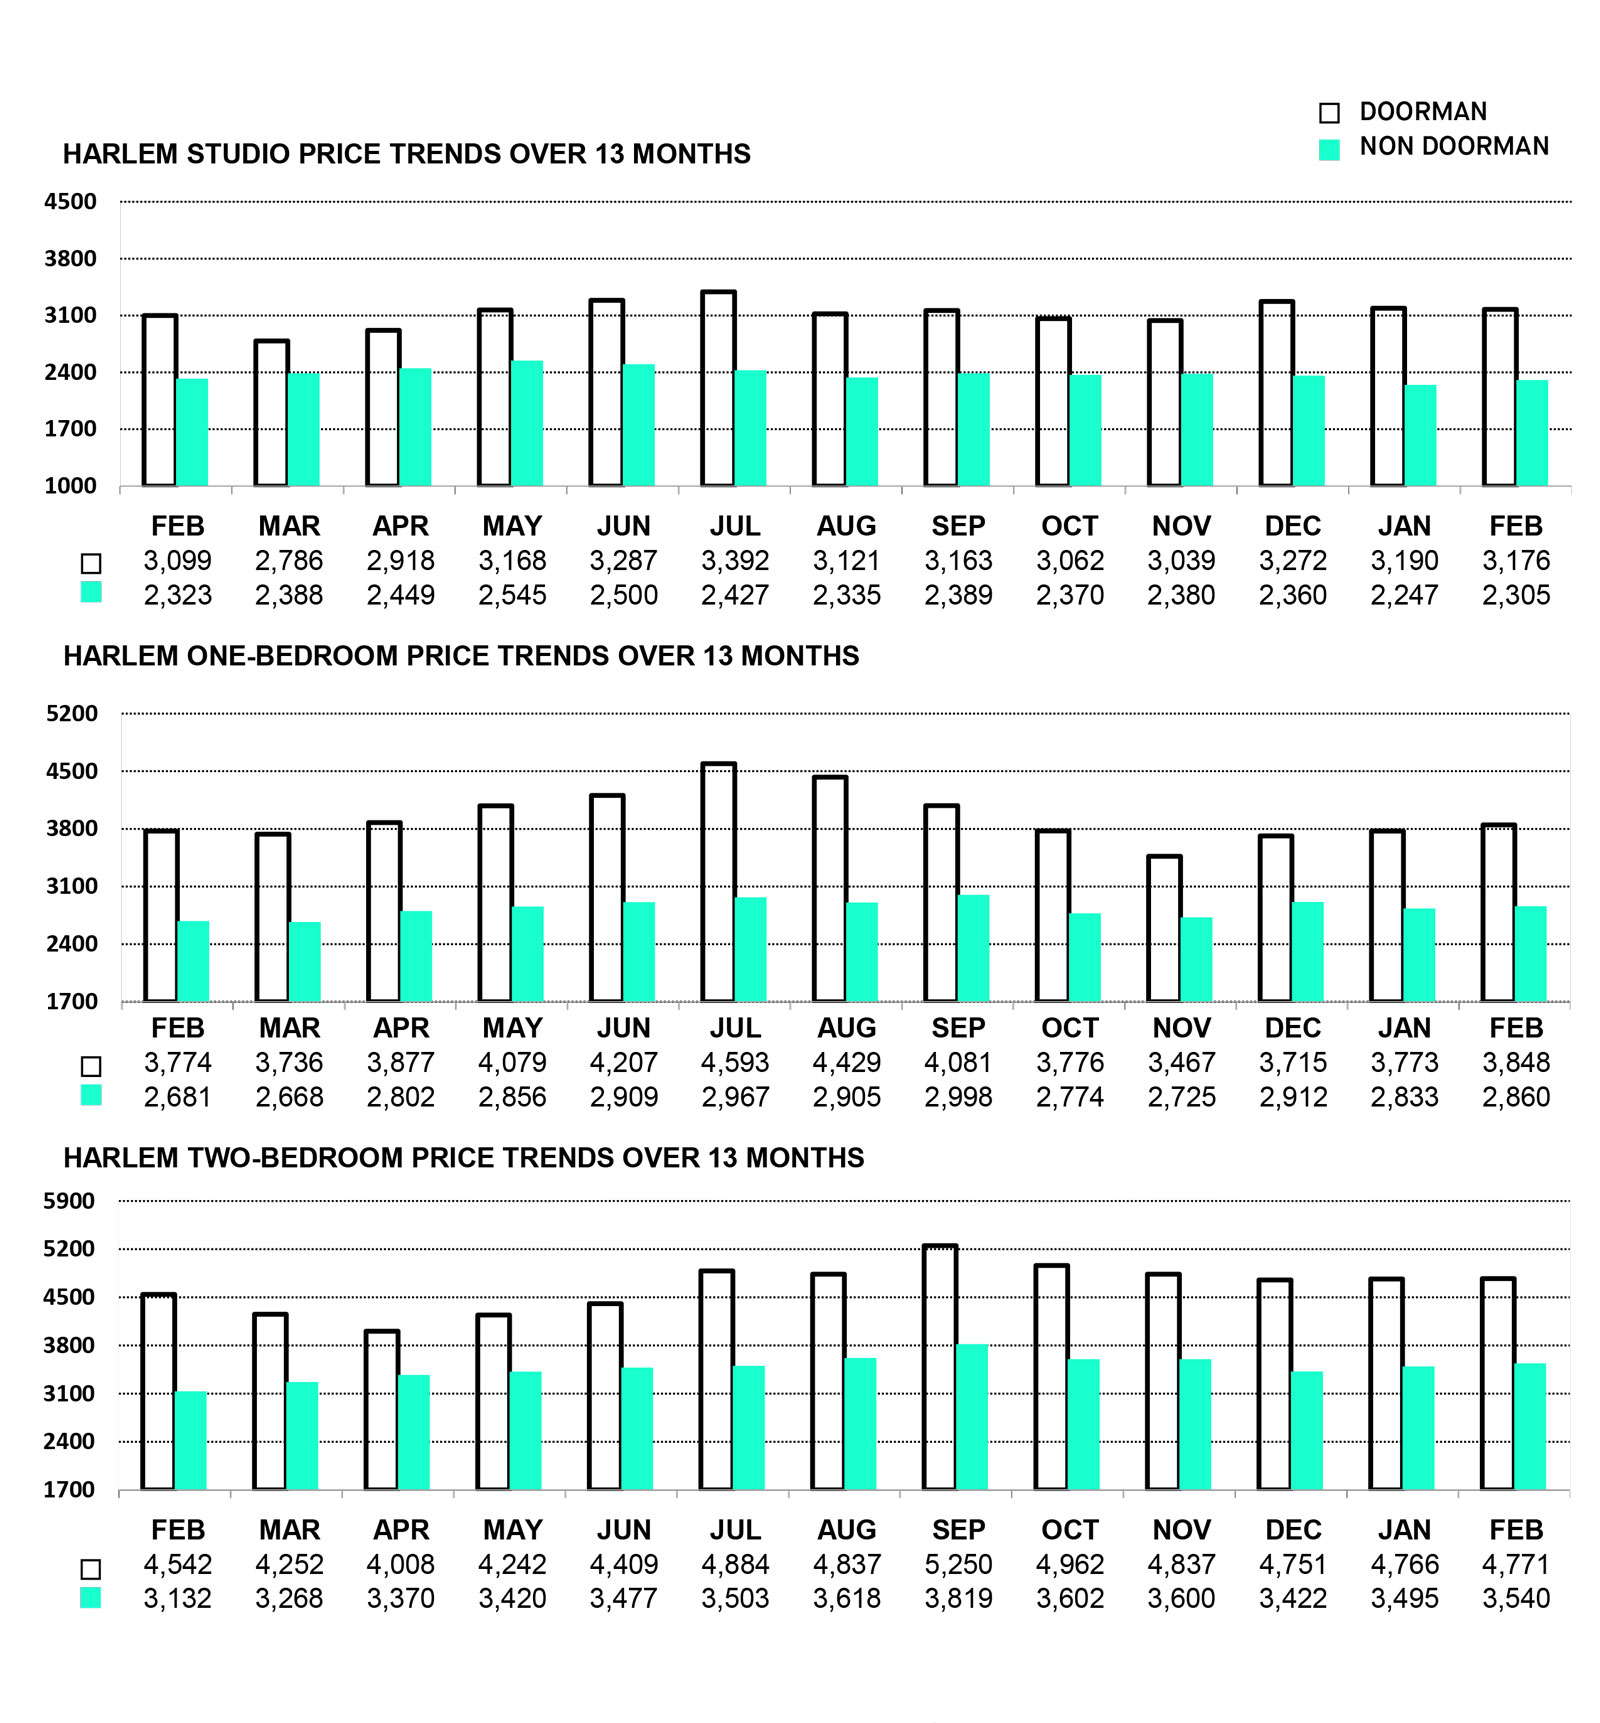
HARLEM PRICE TRENDS
MONTH-OVER-MONTH, DOORMAN RENTS SLIGHTLY INCREASED BY JUST 0.56%, AND NON-DOORMAN RENTS INCREASED BY 1.52%.
LOWER EAST SIDE PRICE TRENDS
AVERAGE DOORMAN RENTS INCREASED BY 3.69% SINCE LAST MONTH, AND NON-DOORMAN RENTS INCREASED BY 5.19%.

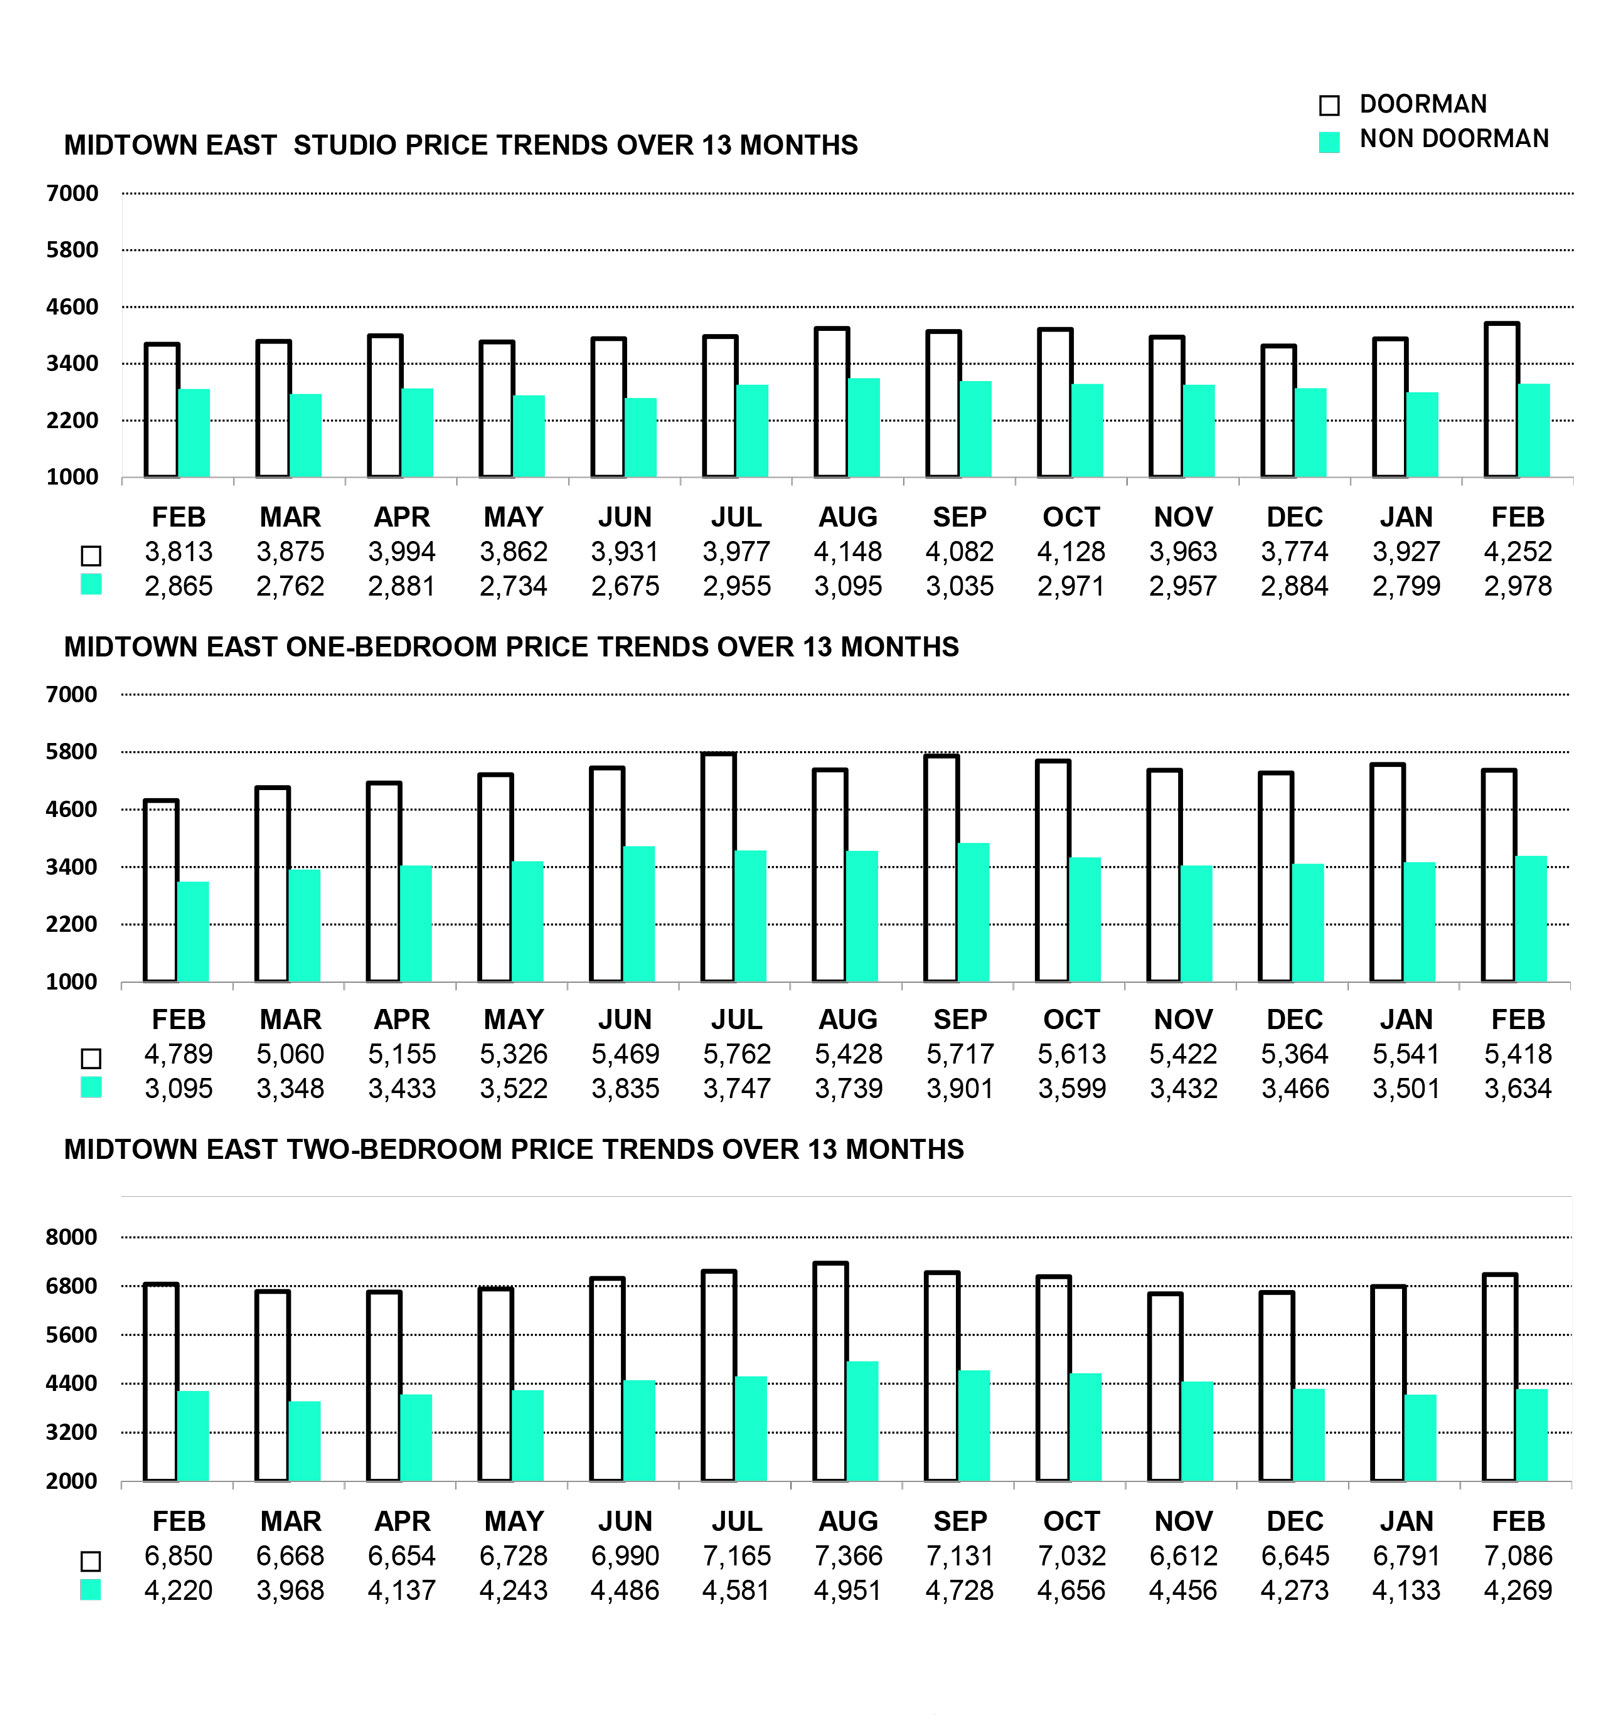
MIDTOWN EAST PRICE TRENDS
FOR THE MONTH OF FEBRUARY, DOORMAN RENTS INCREASED BY 3.06%, AND NON-DOORMAN RENTS INCREASED BY 4.30%.
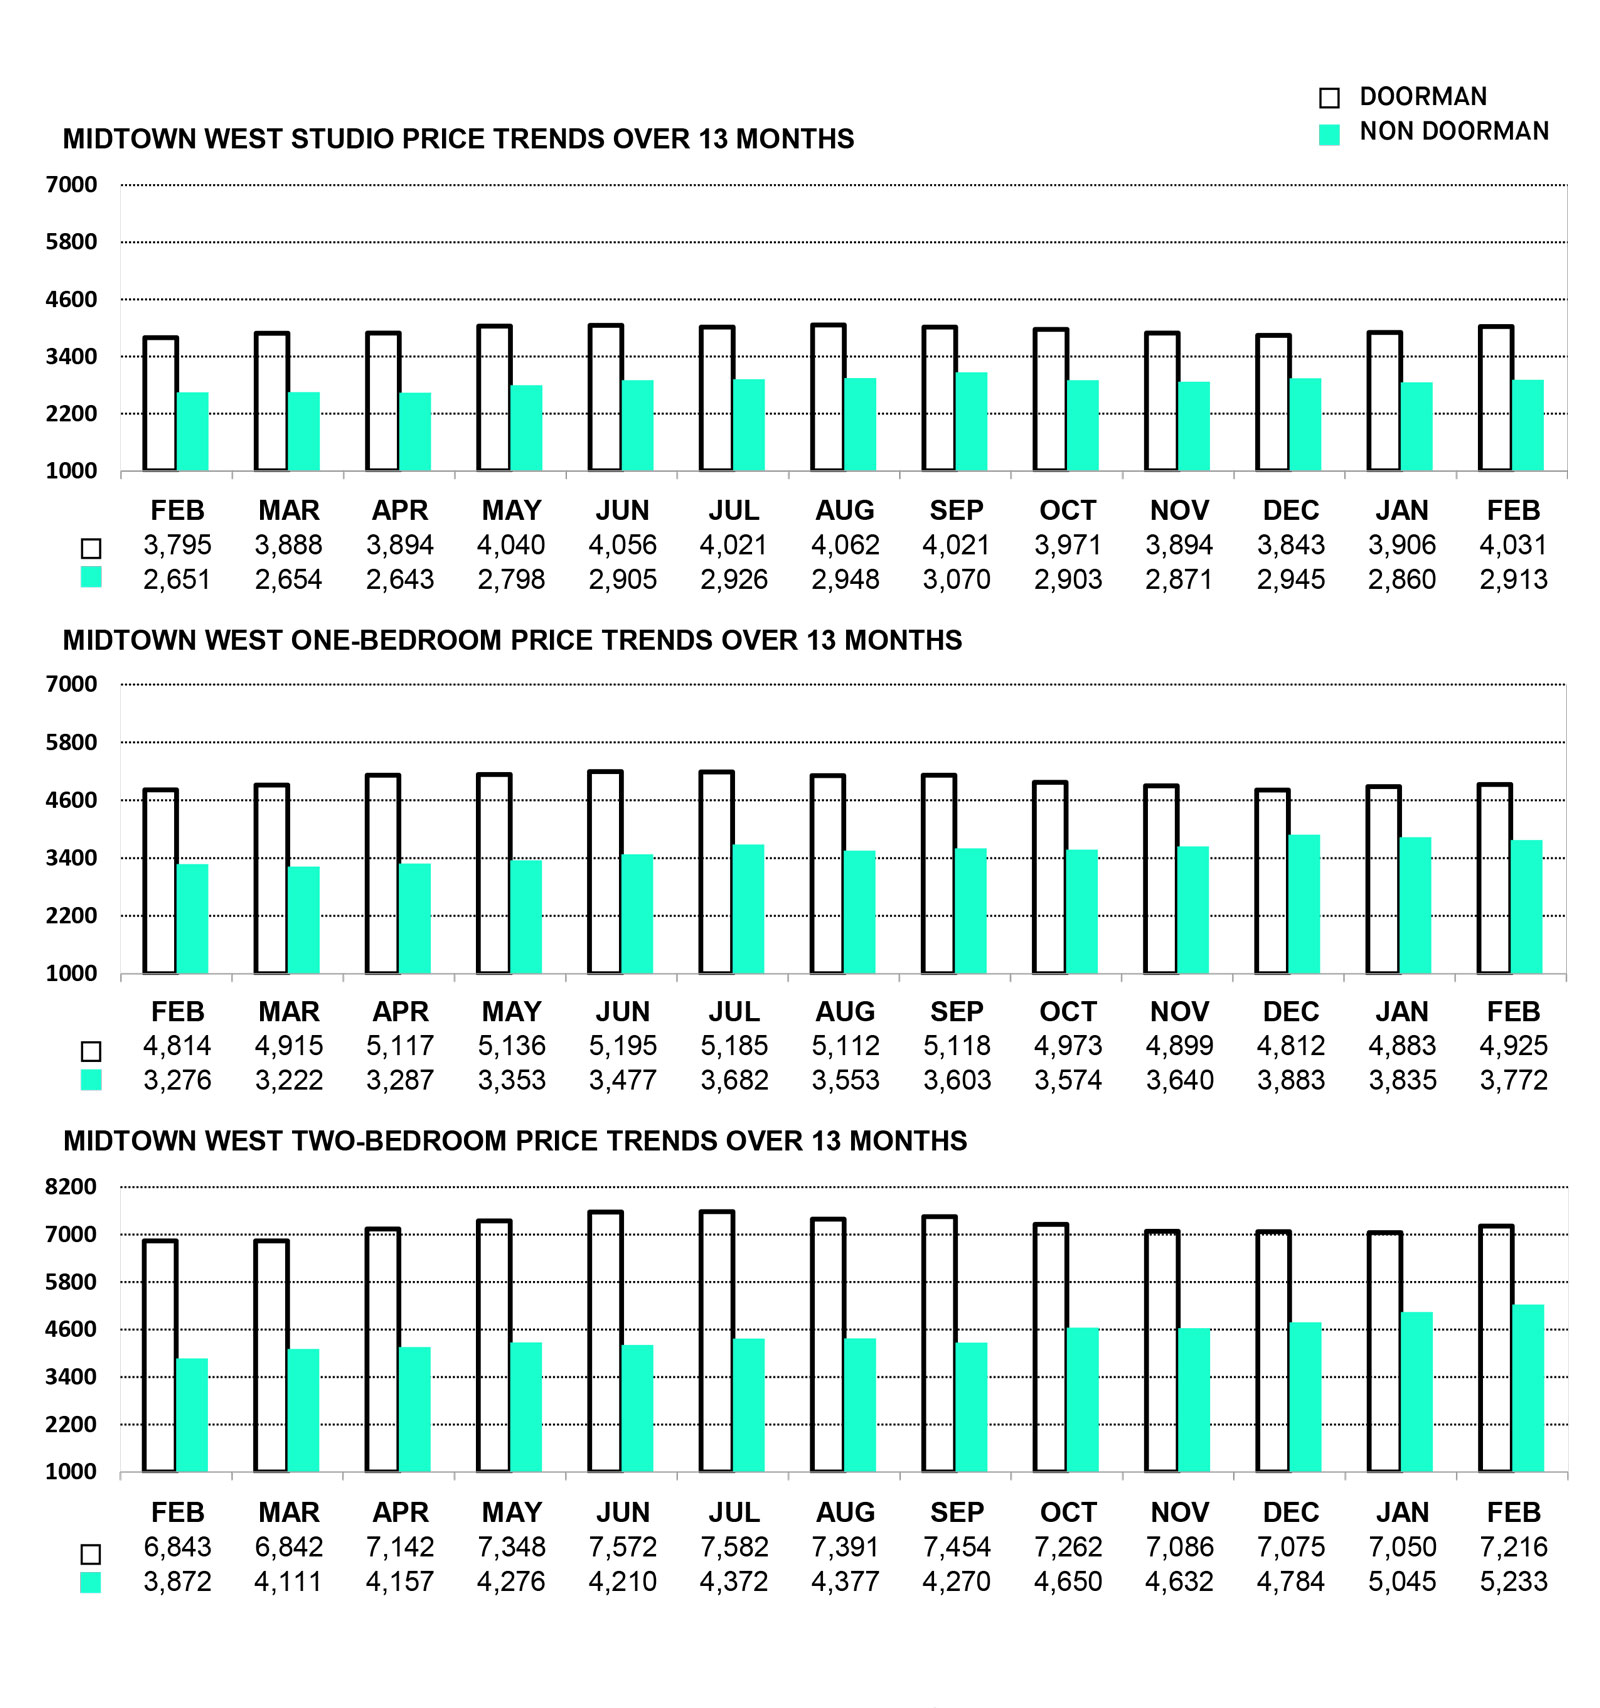
MIDTOWN WEST PRICE TRENDS
THIS PAST MONTH, THE AVERAGE DOORMAN RENTS INCREASED BY 2.10%, AND NON-DOORMAN RENTS INCREASED BY 1.53%.
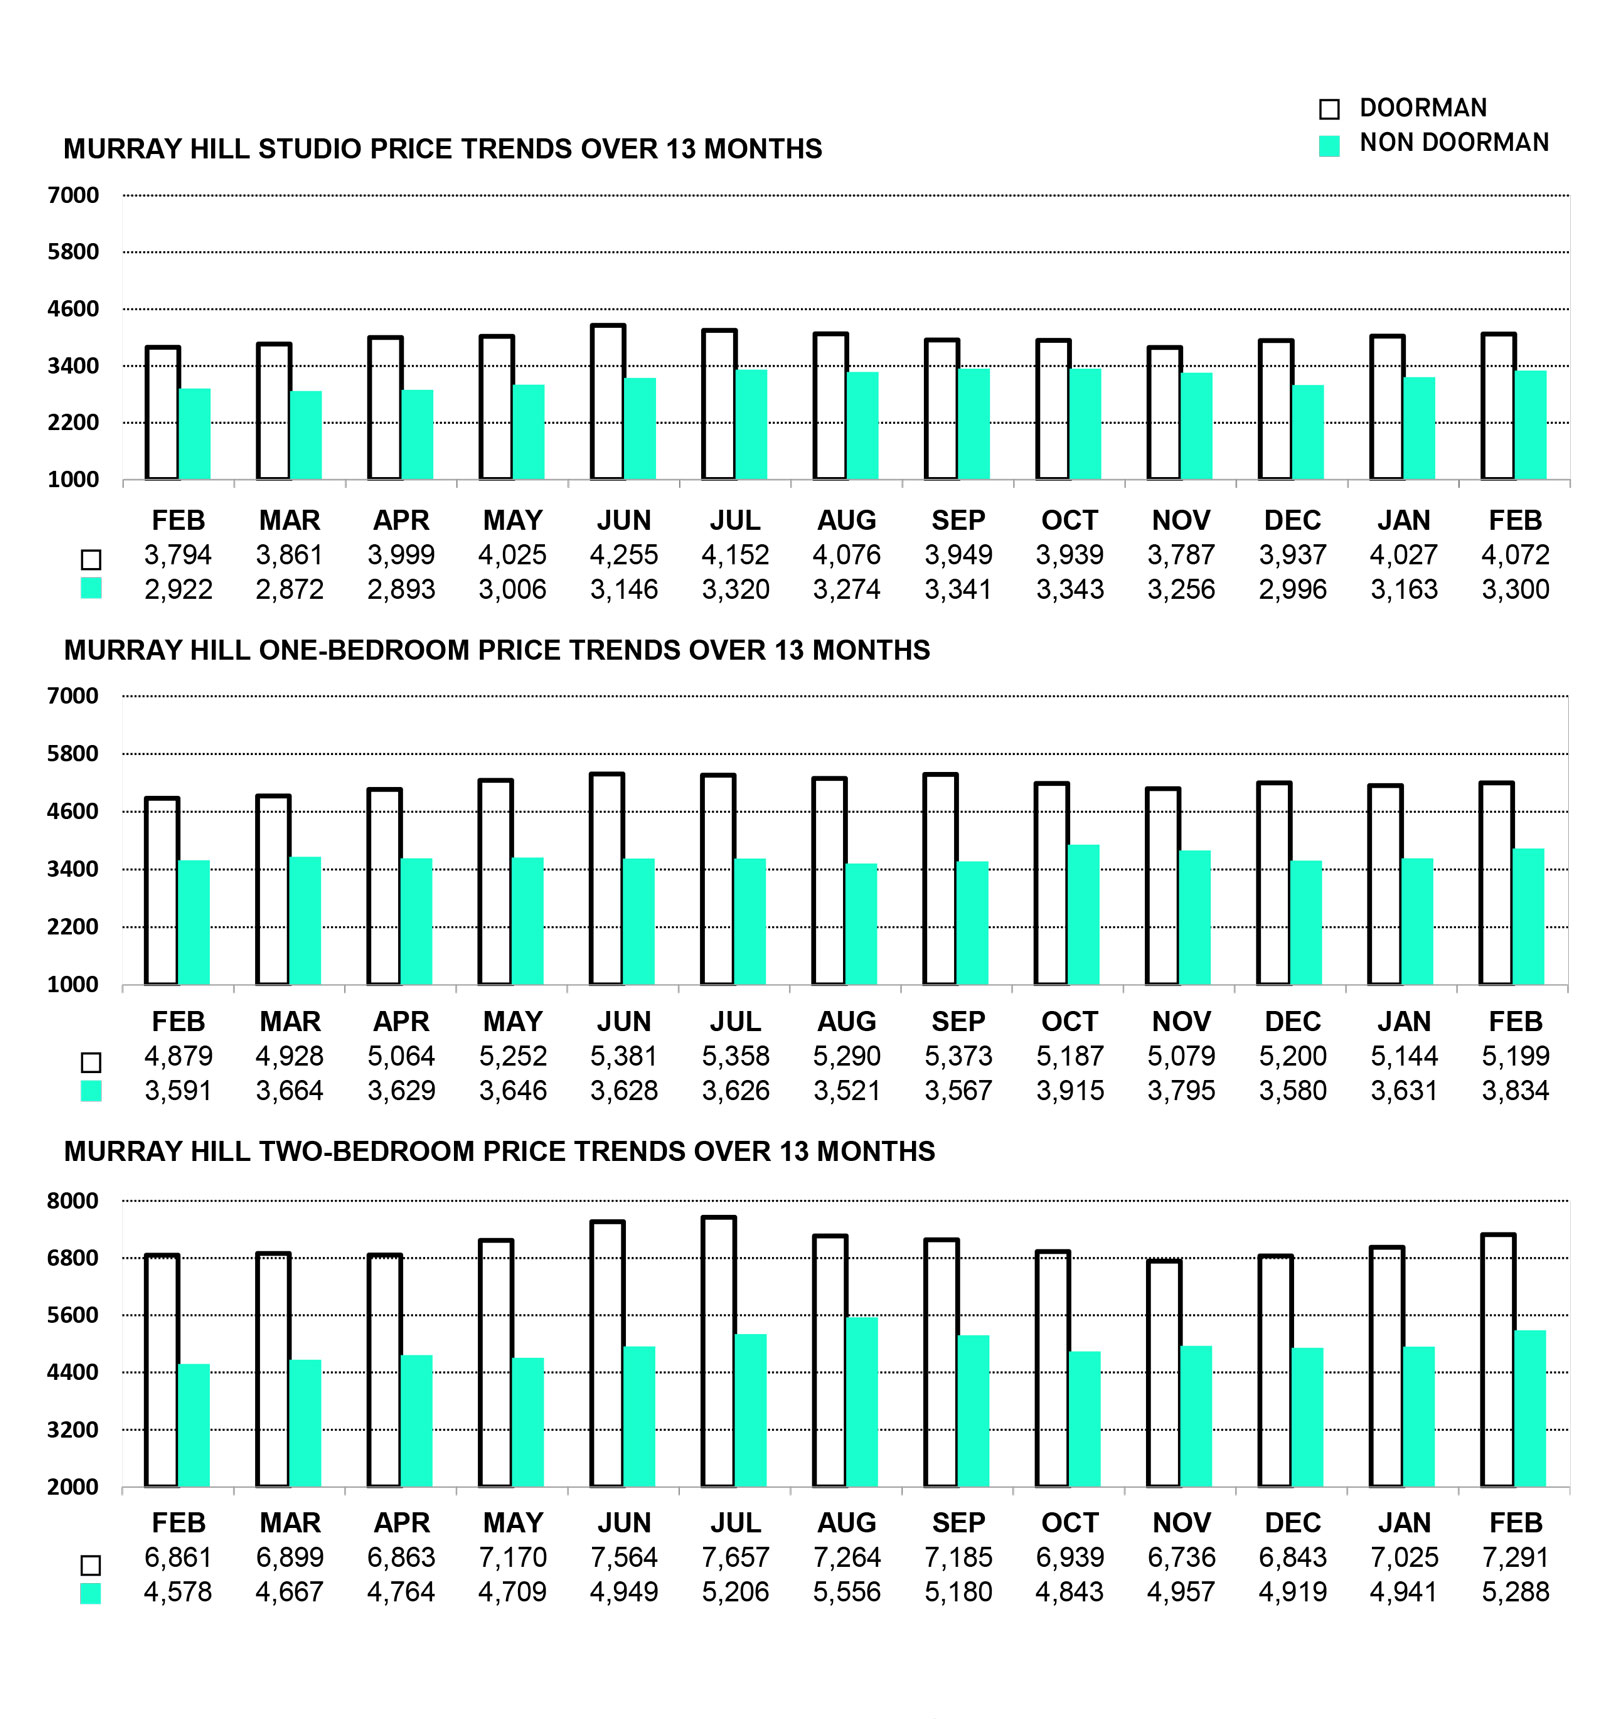
MURRAY HILL PRICE TRENDS
FOR THE MONTH OF FEBRUARY, AVERAGE RENTAL PRICES FOR DOORMAN RENTS INCREASED BY 2.25%, AND NON-DOORMAN RENTS INCREASED BY 5.86%.
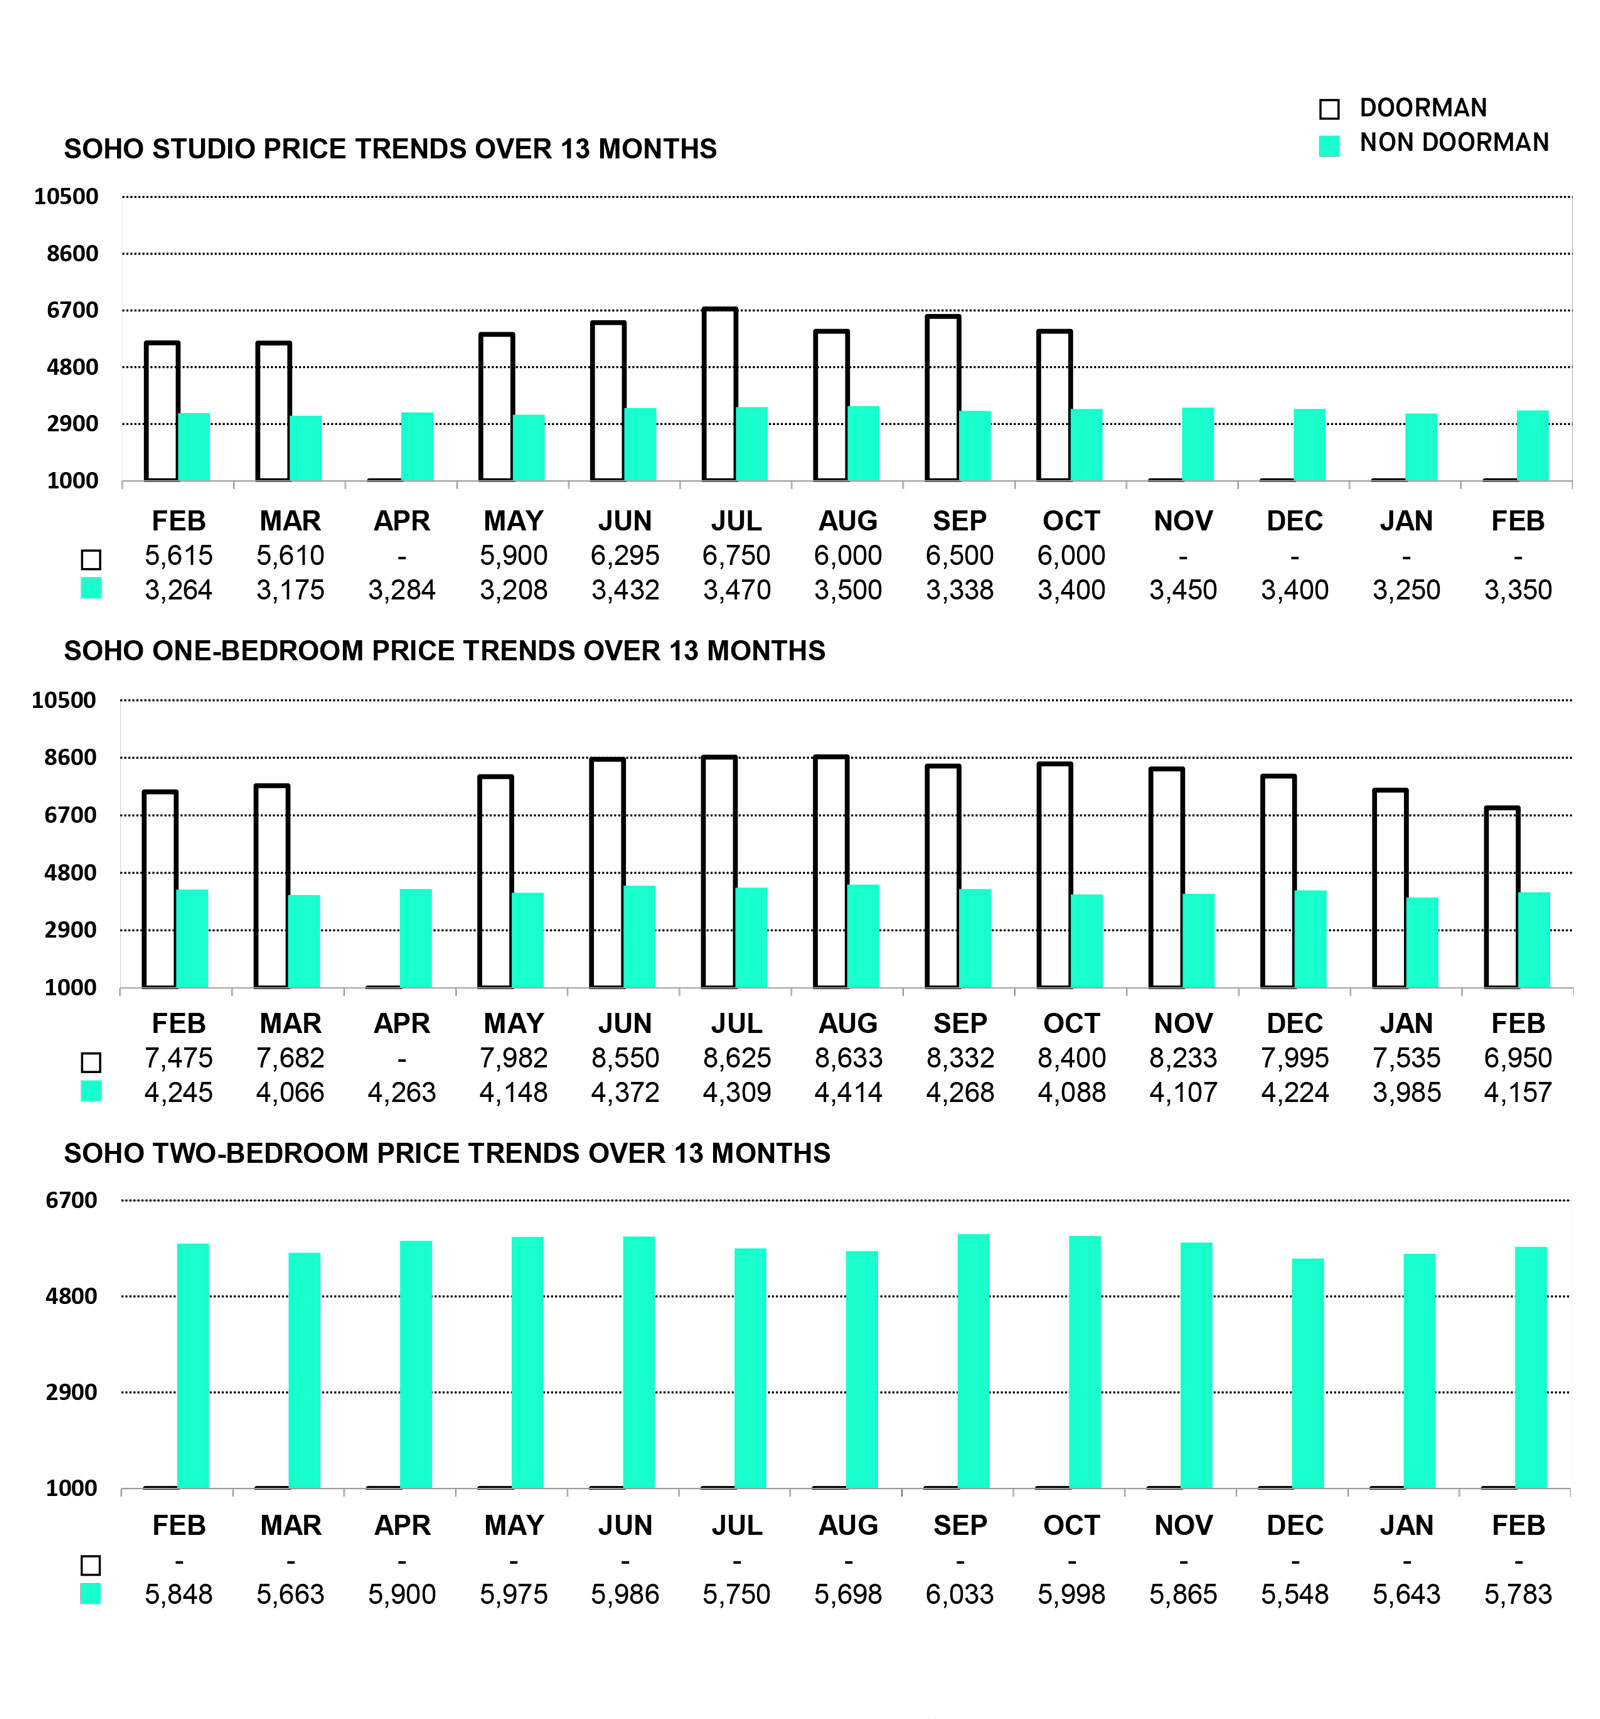
SOHO PRICE TRENDS
OVER THE PAST MONTH, THE AVERAGE RENTAL PRICE FOR A DOORMAN UNIT DECREASED BY 7.76%, WHILE NON-DOORMAN RENTS INCREASED BY 3.20%.
TRIBECA PRICE TRENDS
THIS PAST MONTH, THE AVERAGE RENTAL PRICE FOR A DOORMAN UNIT INCREASED BY 2.74%, AND NON-DOORMAN RENTS INCREASED BY 6.35%.
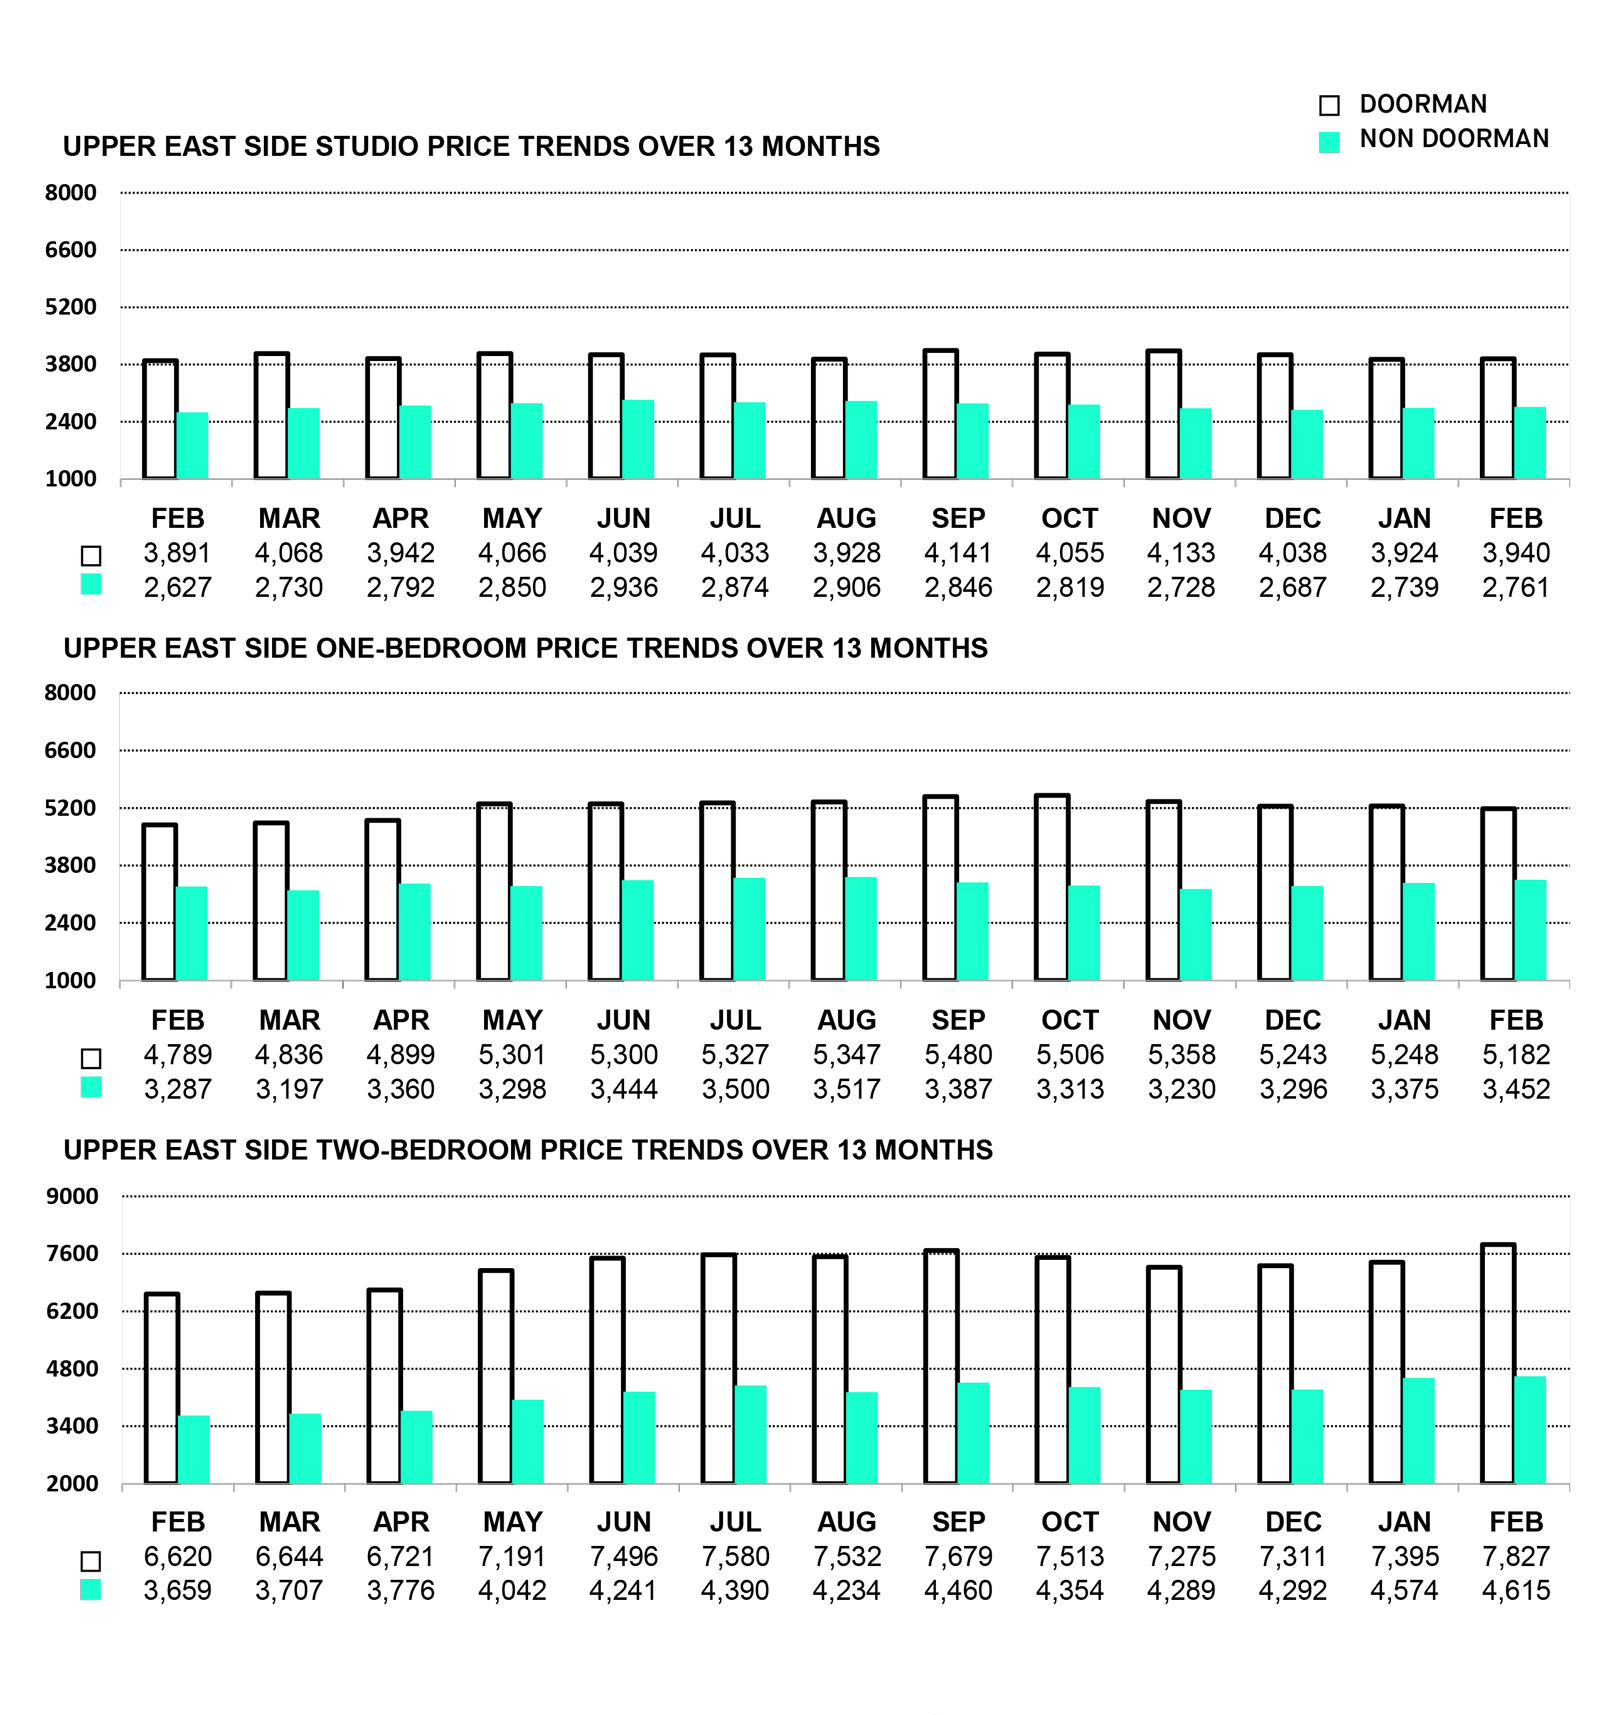
UPPER EAST SIDE PRICE TRENDS
MONTH-OVER-MONTH, AVERAGE DOORMAN RENTAL PRICES HAVE INCREASED BY 2.31%, AND NON-DOORMAN RENTS INCREASED BY 1.31%.
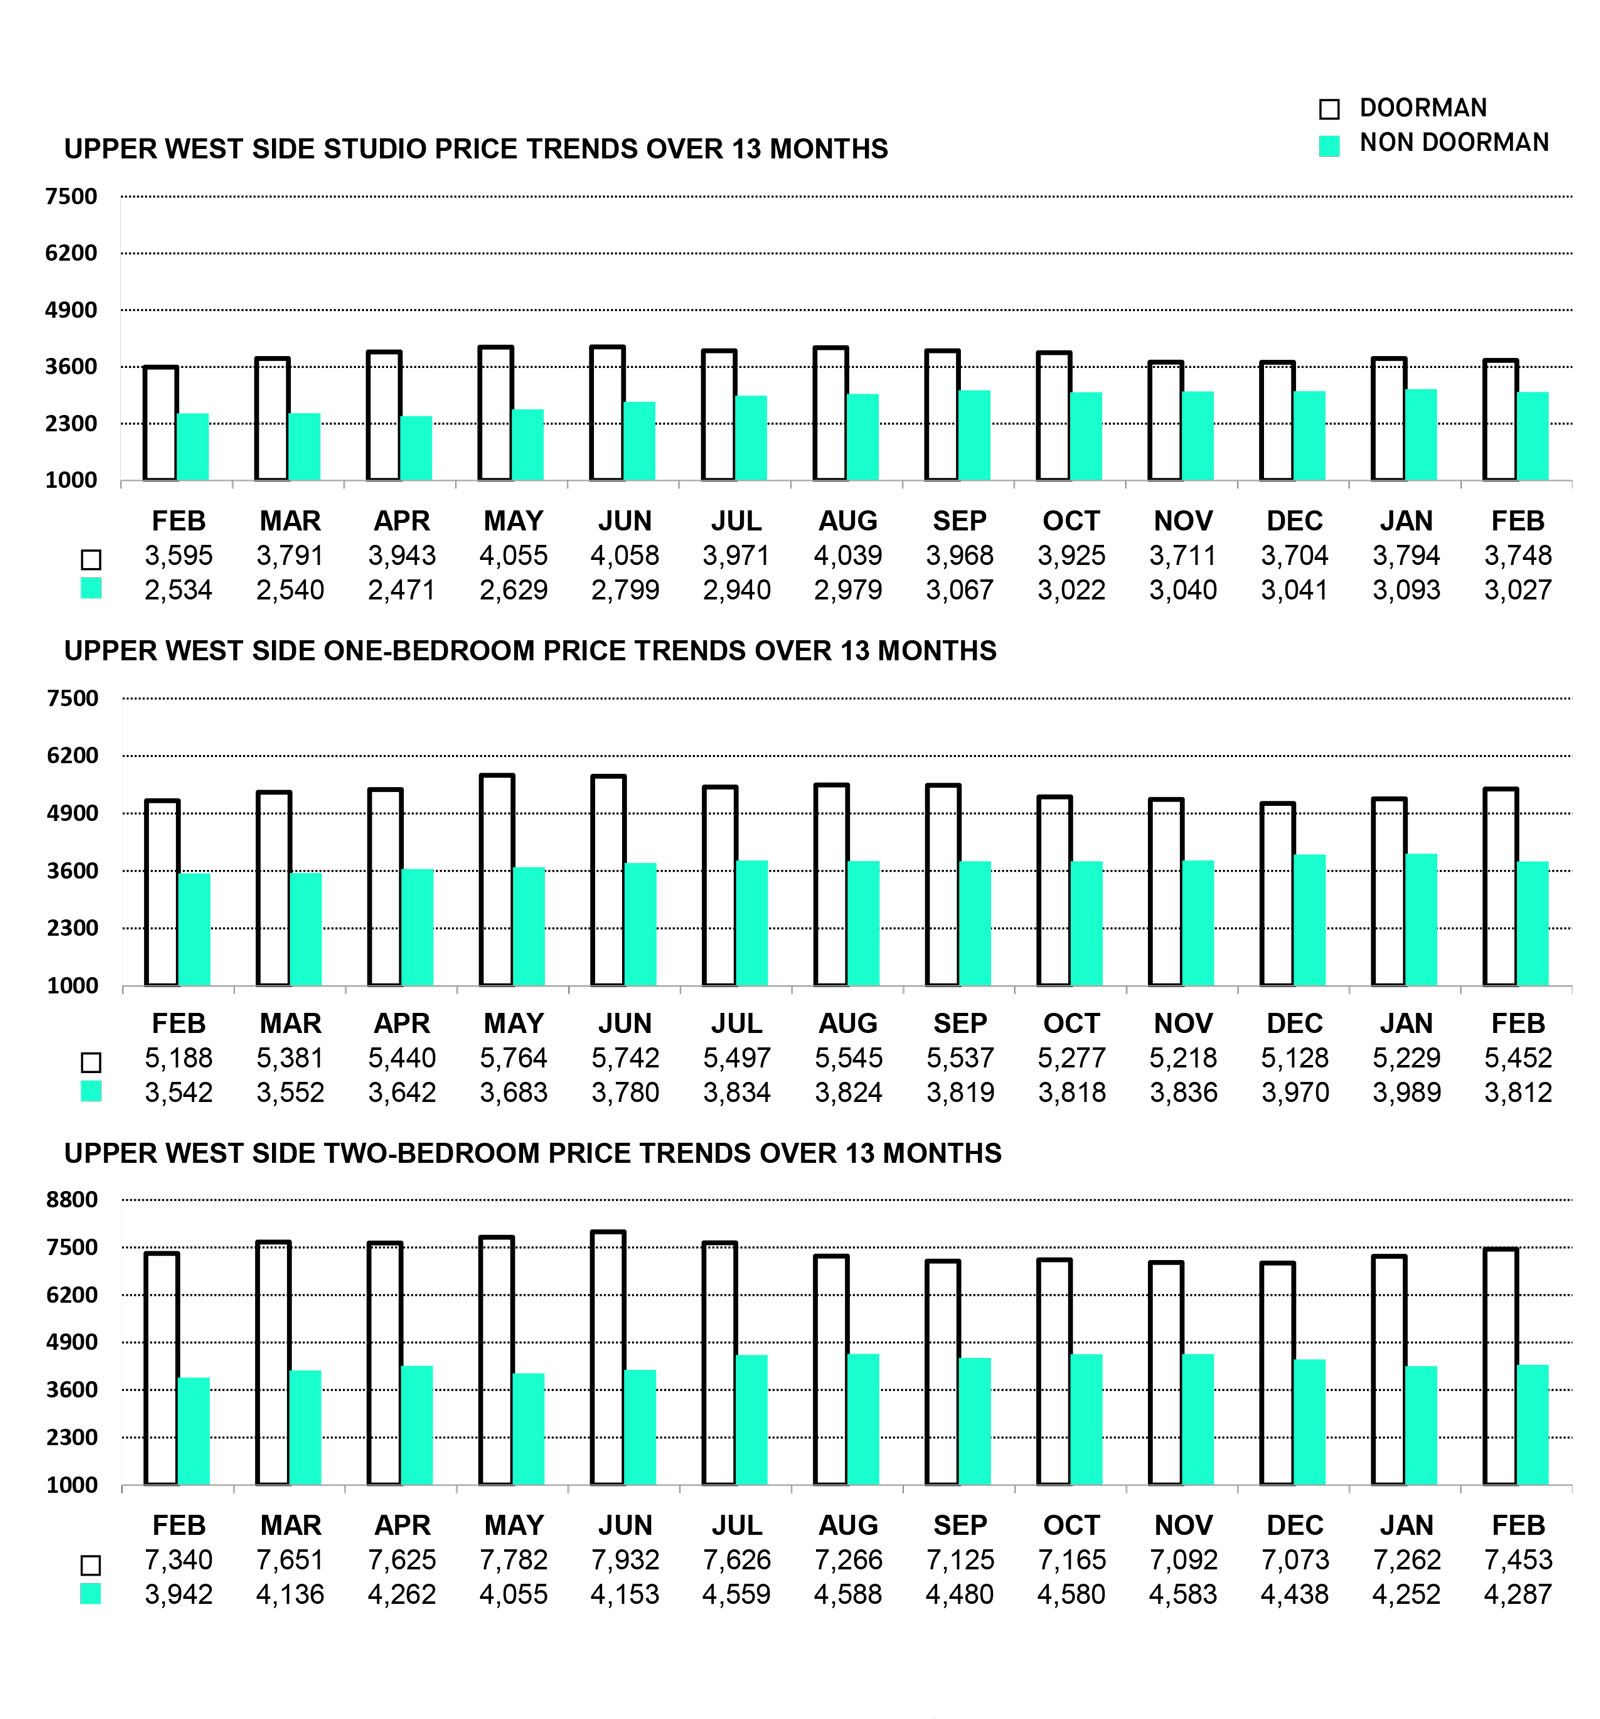
UPPER WEST SIDE PRICE TRENDS
AVERAGE DOORMAN RENTS THIS MONTH HAVE INCREASED BY 2.26%, WHILE NON-DOORMAN RENTS DECREASED BY 1.85%.
WASHINGTON HEIGHTS / INWOOD
AVERAGE DOORMAN RENTS THIS MONTH HAVE DECREASED BY 2.19%, AND NON-DOORMAN RENTS DECREASED BY 4.89%.
THE REPORT EXPLAINED
THE MANHATTAN RENTAL MARKET REPORT COMPARES FLUCTUATION IN THE CITY’S RENTAL DATA ON A MONTHLY BASIS. IT IS AN ESSENTIAL TOOL FOR POTENTIAL RENTERS SEEKING TRANSPARENCY IN THE NYC APARTMENT MARKET AND A BENCHMARK FOR LANDLORDS TO EFFICIENTLY AND FAIRLY ADJUST INDIVIDUAL PROPERTY RENTS IN MANHATTAN.
The Manhattan Rental Market Report is based on data cross-sectioned from over 10,000 currently available listings located below 125th Street and priced under $10,000, with ultra-luxury property omitted to obtain a true monthly rental average. Our data is aggregated from the MNS proprietary database and sampled from a specific mid-month point to record current rental rates offered by landlords during that particular month. It is then combined with information from the REBNY Real Estate Listings Source (RLS), OnLine Residential (OLR. com) and R.O.L.E.X. (Real Plus).
Author: MNS has been helping Manhattan & Brooklyn landlords and renters navigate the rental market since 1999. From large companies to individuals, MNS tailors services to meet your needs. Contact us today to see how we can help.
Contact Us Now: 718-222-0211
Note: All market data is collected
and compiled by MNS’s marketing department. The information presented here is intended for instructive purposes only and has been gathered from sources deemed reliable, though it may be subject to errors, omissions, changes or withdrawal without notice.
If you would like to republish this report on the web, please be sure to source it as the “Manhattan Rental Market Report” with a link back to its original location.